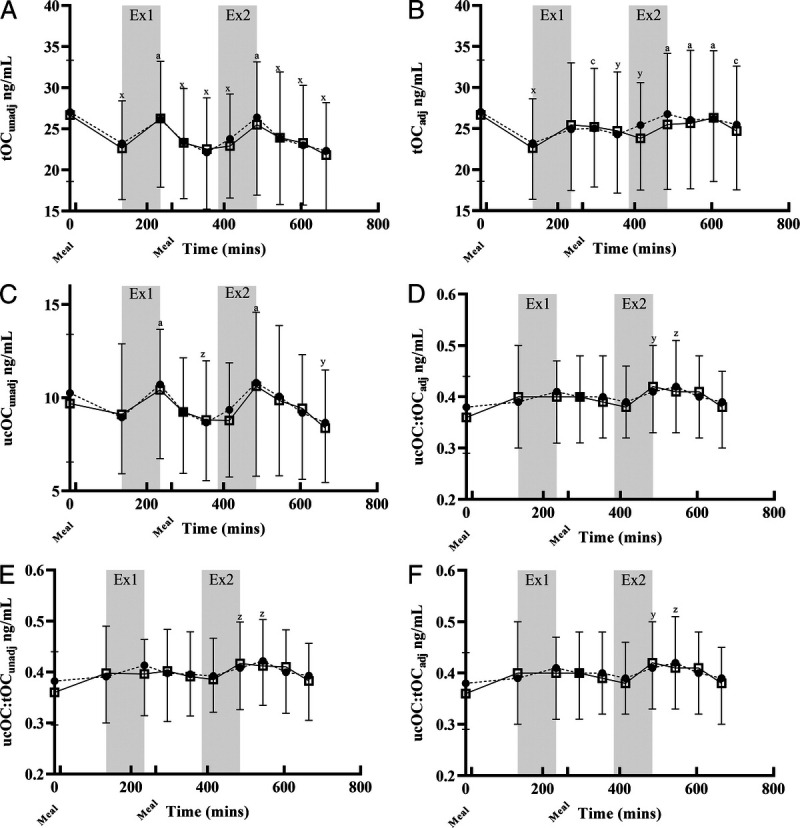
FIGURE 4.

Osteocalcin: no effect of treatment was seen on any measure of osteocalcin. *P < 0.05, **P < 0.01, P < 0.001; x, y, and z indicate P < 0.001, P < 0.01, and P < 0.05, respectively, relative to B1. A, B, and C indicate P < 0.001, P < 0.01, and P < 0.05, respectively, relative to B2. Data are presented mean ± SD. Graphs B, D, and F are adjusted for hemoconcentration (adj). A, tOCunadj: effect of time (P < 0.001). B, tOCadj: effect of time (P < 0.001). C, ucOCunadj: effect of time (P < 0.001). D, ucOCadj: effect of time (P < 0.001). E, ucOC/tOCunadj: effect of time (P < 0.01). F, ucOC/tOCadj: effect of time (P < 0.01). Calcium and Control.
