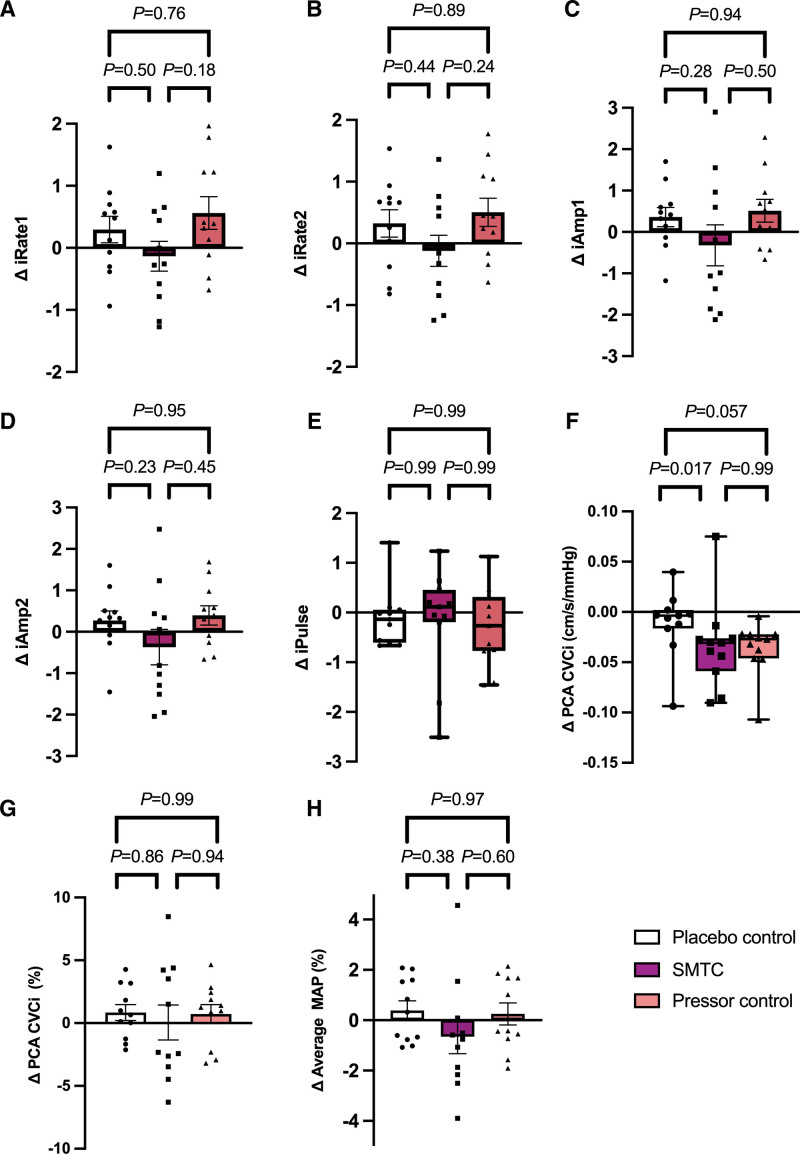
Figure 4.
Neurovascular coupling response. Change in iNVC summary metrics of rapidity (A, B), amplitude (C, D) and pulsatility (E) of response between SMTC and control conditions. F, G, comparisons of absolute and percent PCA conductance between SMTC and control conditions. N, Changes in MAP during the NVC response between SMTC and control conditions. Posterior cerebral artery (PCA), S-methyl-L-thiocitrulline (SMTC), mean arterial pressure (MAP), cerebrovascular conductance index (CVCi). Comparisons between SMTC and control conditions were conducted using 1 way ANOVA with Tukey post hoc test (A–D, F-–H) or Friedman test with Dunn’s multiple comparison test (E). Data presented as mean±SEM (A–D, G, H) or median (IQR) (E and F). n=11.

