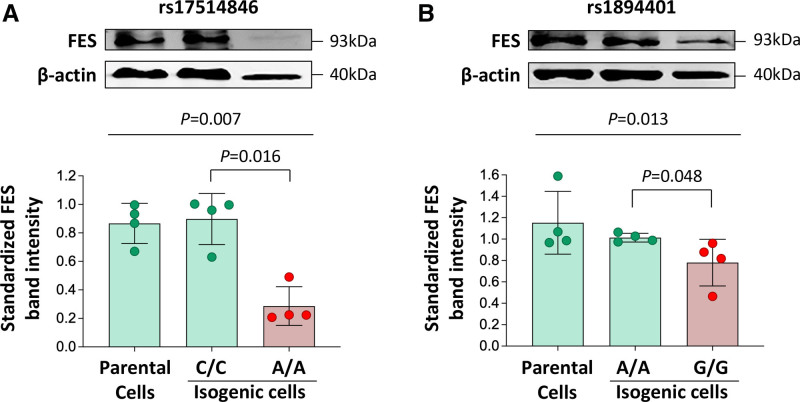
Figure 2.
Differences in FES (FES proto-oncogene, tyrosine kinase) expression level between isogenic monocytic cell lines generated by CRISPR (clustered regularly interspaced short palindromic repeats)-mediated genome editing. Human THP-1 monocytic cells were subjected to CRISPR-mediated genome editing to generate isogenic cells of the C/C genotype and isogenic cells of the A/A genotype, respectively, of rs17514846 (A) or isogenic cells of the A/A and G/G genotypes, respectively, of rs1894401 (B). FES levels in the isogenic cell lines were determined by immunoblot analysis. Average representative immunoblot images (top); FES band intensities standardized against band intensities of the reference protein β-actin (bottom). Columns and error bars indicate mean±SD values from n=4 per group; P values from Kruskal-Wallis test with multiple comparisons adjusting for the number of comparison.

