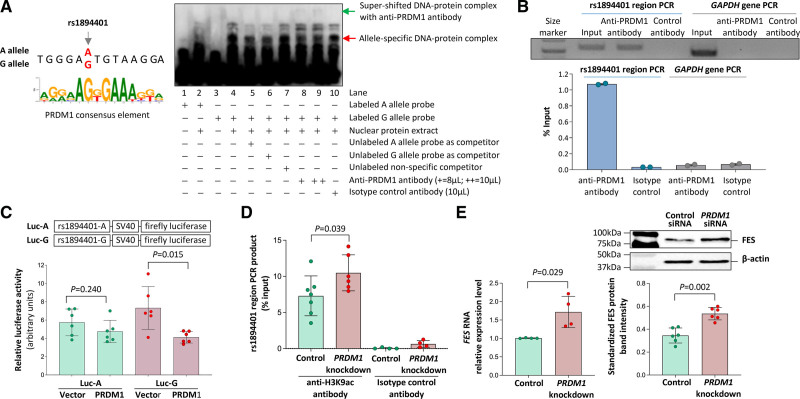
Figure 3.
Interaction of the rs1894401 site with the transcription factor PRDM1 (PR/SET Domain 1). A‚ Left‚ The G allele of rs1894401 has a greater similarity to the consensus DNA sequence for PRDM1 binding28 than the A allele. Right‚ An average representative image of electrophoretic mobility super-shift assay of THP-1 monocytic cells using probes corresponding to either the A or G allele and an anti-PRDM1 antibody. B‚ Results of chromatin immunoprecipitation analysis of PRDM1. Top‚ Image of gel electrophoresis of PCR products of the rs1894401 region and the GAPDH gene (serving as a control), respectively, from input DNA, anti-PRDM1 antibody immunoprecipitated DNA, or isotype control antibody immunoprecipitated DNA. Bottom‚ the amounts of PCR products from immunoprecipitated DNA as compared to amounts of PCR products from input DNA, determined by quantitative PCR analysis. C‚ Results of luciferase assay. Two plasmids containing DNA sequences (152bp) corresponding to either the A or G allele of rs1894401 followed by a firefly luciferase reporter gene were generated. Each of these plasmids, together with a plasmid containing a Renilla luciferase gene to serve as a transfection efficiency reference, was transfected into macrophages (Raw 264.7 cells), followed by dual luciferase assays. Data shown are mean (±SD) of standardized firefly luciferase activity (the ratio of firefly luciferase activity over Renilla luciferase activity), n=6 per group, P values from 2-tailed Mann-Whitney test. D‚ THP-1 monocytic cells with and without PRDM1 knockdown (knockdown of PRDM1 is shown in Figure S1) were subjected to chromatin immunoprecipitation with either an anti-H3K9ac antibody or an isotype control antibody, followed by a quantitative PCR analysis of the rs1894401 region. Data shown are mean (±SD) of the amounts of PCR products from DNA immunoprecipitated with the anti-H3K9ac antibody or the isotype control antibody, relative to the amounts of PCR products from input DNA; n=4-7 per group; P value from 2-tailed Mann-Whitney test. E‚ Results of FES (FES proto-oncogene, tyrosine kinase) reverse transcription (RT)-PCR (left) and FES immunoblot analysis (right) of THP-1 cells with and without PRDM1 knockdown (knockdown of PRDM1 is shown in Figure S1). Left‚ Mean (±SD) of FES RNA levels relative to ACTB RNA level, determined by the ΔCt method; n=4 per group; P value from 2-tailed Mann-Whitney test. Top right‚ Average representative immunoblot images. Bottom right‚ Mean (±SD) of FES protein band intensities standardized against band intensities of the reference protein β-actin, from n=6 per group; P value from 2-tailed Mann-Whitney test.

