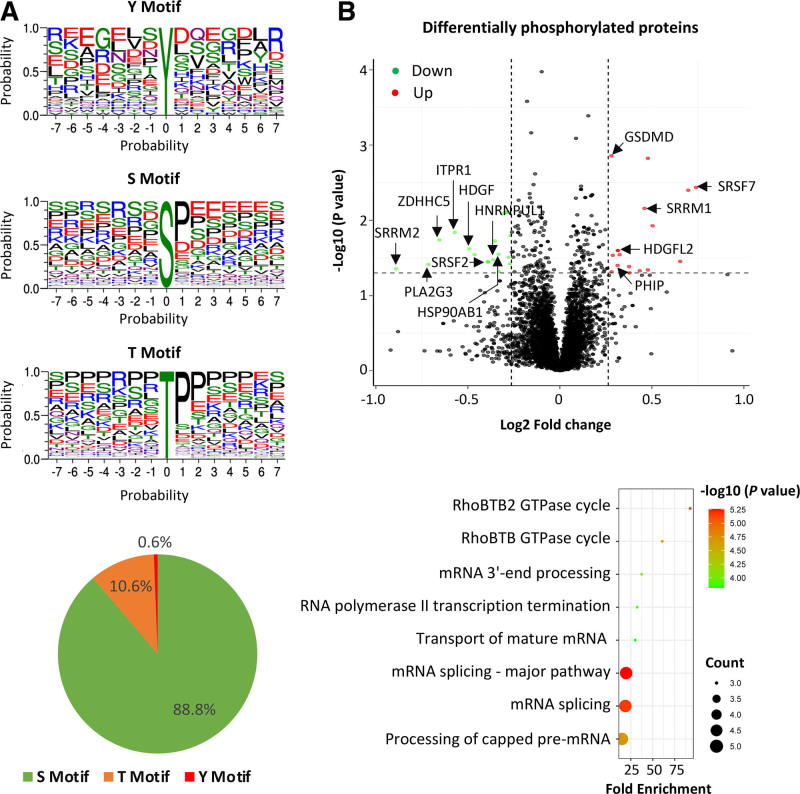
Figure 5.
Results of phosphoproteomics analysis of monocytes with vs without FES (FES proto-oncogene, tyrosine kinase) knockdown. A, Motifs of phosphorylation of tyrosine (Y), serine (S), and threonine (T), detected. B, Top‚ Volcano plot of proteins (represented by red or green dots) that are differentially phosphorylated in cells with small interfering RNA (siRNA)-mediated FES knockdown compared with cells transfected with a negative control siRNA. Bottom‚ Bubble plot showing pathways with enrichment of proteins that are differentially phosphorylated in cells with siRNA-mediated FES knockdown compared with cells transfected with a negative control siRNA. P values are from Fisher exact test implemented with the default setting of Gene Ontology enrichment analysis (http://geneontology.org). GSDMD indicates gasdermin D; HDGF, heparin binding growth Factor; HDGFL2, hepatoma-derived growth factor-related protein 2; HNRNPUL1; heterogeneous nuclear ribonucleoprotein U like 1; HSP90AB1, heat shock protein 90 alpha family class B member 1; ITPR1, inositol 1,4,5-trisphosphate receptor type 1; PHIP, pleckstrin homology domain interacting protein; PLA2G3, phospholipase A2 group III; SRRM1, serine/arginine repetitive matrix 1; SRRM2, serine/arginine repetitive matrixx 2; SRSF7, serine/arginine-rich splicing factor 7; and ZDHHC5, zinc finger DHHC-type palmitoyltransferase 5.

