Figure 6.
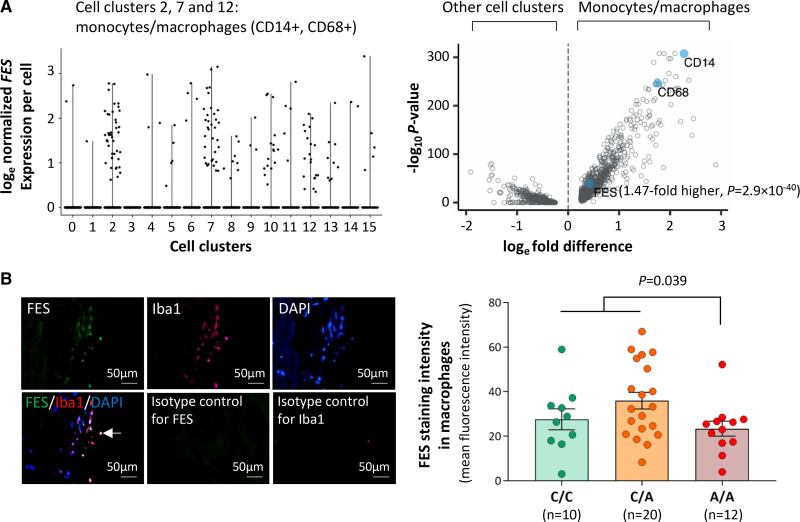
FES (FES proto-oncogene, tyrosine kinase) expression in monocytes/macrophages in human atherosclerotic plaques. A, Results of single-cell transcriptomic analysis of human atherosclerotic plaques. Left‚ Graph shows that in atherosclerotic plaques, cells (represented by black dots), which express FES are predominantly monocytes/macrophages. The x-axis shows different cell clusters, specifically, 2/7/12: monocytes/macrophages (CD14+, CD68+); 0/1/3/4/5/6/9: T lymphocytes (CD3E+); 8: smooth muscle cells (ACTA2+, MYH11+); 10/13: endothelial cells (CD34+, PECAM1+); 11: B lymphocytes (CD79A+); 15: mast cells (KIT+). The y-axis shows normalized FES expression levels with natural logarithm transformation (as described in the Supplemental Material). Right‚ Graph shows higher FES expression in monocytes/macrophages (cell clusters 2/7/12) than in other cell clusters. Each blue closed circle or opened circle symbolizes one gene. The x-axis shows mean loge-transformed, normalized fold differences in gene expression comparing monocytes/macrophages vs all other cell clusters. The y-axis shows log10 P-values for comparisons between monocytes/macrophages and all other cell clusters in gene expression. B, Human coronary atherosclerotic plaques from different individuals were subjected to double fluorescent immunostaining for FES and the macrophage marker ionized calcium binding adaptor molecule 1 (Iba1). Nuclei were stained with DAPI (4′,6-diamidino-2-phenylindole). Fluorescent immunostaining images were analyzed using Image-Pro Plus image analysis software. Left, Average representative images. The arrow indicates FES and Iba1 double positive staining; Right, FES mean fluorescence intensity in macrophages (Iba1 positive) in atherosclerotic plaques from individuals of the C/C, C/A, and A/A genotypes, respectively. Columns and error bars indicate mean±SEM. Numbers per group are indicated in the figure. The P value is from a 2-tailed t-test.

