Figure 8.
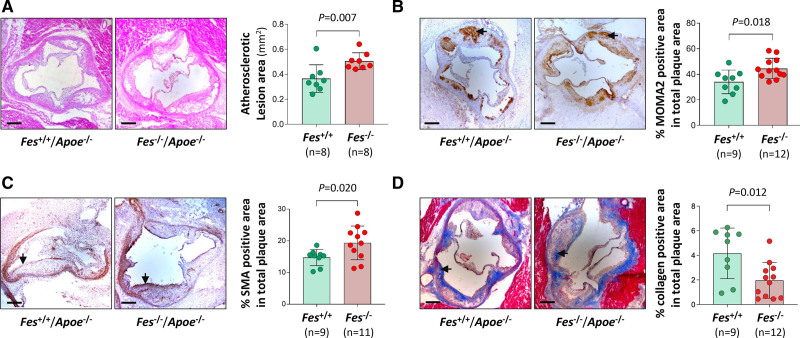
Differences between Fes-/-/Apoe-/- mice and Fes+/+/Apoe-/- mice in atherosclerotic lesion size and composition. Fes-/-/Apoe-/- mice and Fes+/+/Apoe-/- littermates were fed a high fat diet for 12 weeks from 6 weeks of age. Thereafter, aortic root sections were subjected to hematoxylin/eosin staining (A), immunostaining for monocytes/macrophages (MOMA2) (B), immunostaining for smooth muscle cells (SMA) (C), and Masson trichrome staining for collagen (D). Morphometric quantification was performed with the use of Fiji software. Arrows indicate stain-positive areas. Bars, 200 μm. Mean (SD) values in the Fes-/-/Apoe-/- group and the Fes+/+/Apoe-/- group, respectively, were 0.505 (0.067) mm2 and 0.365 (0.111) mm2 for atherosclerotic lesion area in the aortic root sections (A), 44.52% (7.97%) and 34.02% (9.25%) for MOMA2 positive stain area (B), 19.36% (5.32%) and 14.73% (2.57%) for SMA positive stain area (C), and 1.97% (1.45%) and 4.16% (2.06%) for collagen positive stain area (D). Numbers per group are shown in the figure. P values are from 2-tailed Mann-Whitney test.

