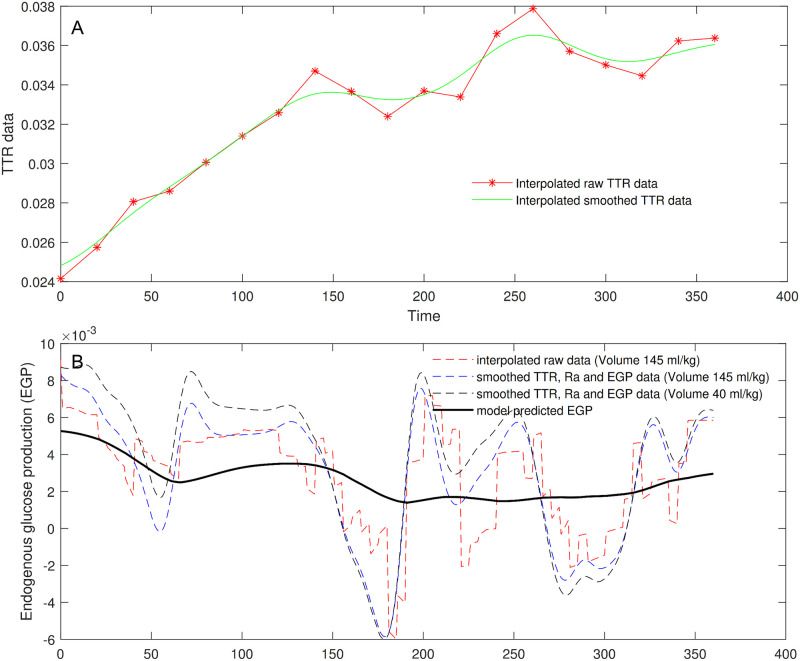
Fig 2. Endogenous glucose production.
TTR data (Panel A), only interpolated (dashed red line) and smoothed (continuous green line); EGP computation from the equation of Steele in case TTR data are smoothed and in case they are only interpolated (Panel B). Four different trends of EGP were computed using not smoothed (dashed red line) or smoothed (blue and black dashed lines) TTR data with different glucose distribution volumes (145 ml/kg or 40 ml/kg, respectively), and derived by the model predictions (continuous black line).

