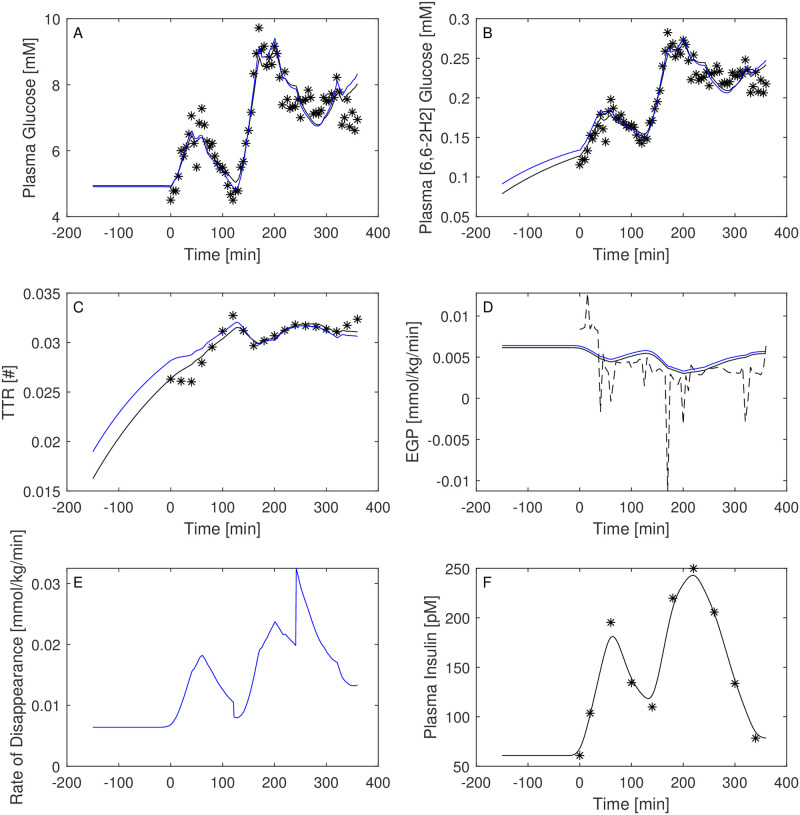
Fig 6. Predictions for Subject 4.
Observed (asterisks) and predicted (line) variables over time (IGT subject). EGP: Endogenous Glucose Production; TTR: Tracer to Tracee ratio. Plasma glucose concentration (Panel A); Plasma [6, 6-2H2]glucose (Panel B); TTR (Panel C); EGP (Panel D), dashed line is the predicted EGP with the Steele model; Rate of disappearance (panel E); Plasma Insulin concentrations (Panel F). All the observed points refer to data measured on day 2. Plasma glucose concentrations (panel A) are derived from the glucose intra-venous infusion to match plasma glucose observations from the OGTTs of day 1. Black lines in panels A, B, C, D and E are model predictions from WLS estimation procedure; blue lines derive from the estimation approach which uses autocorrelated errors.

