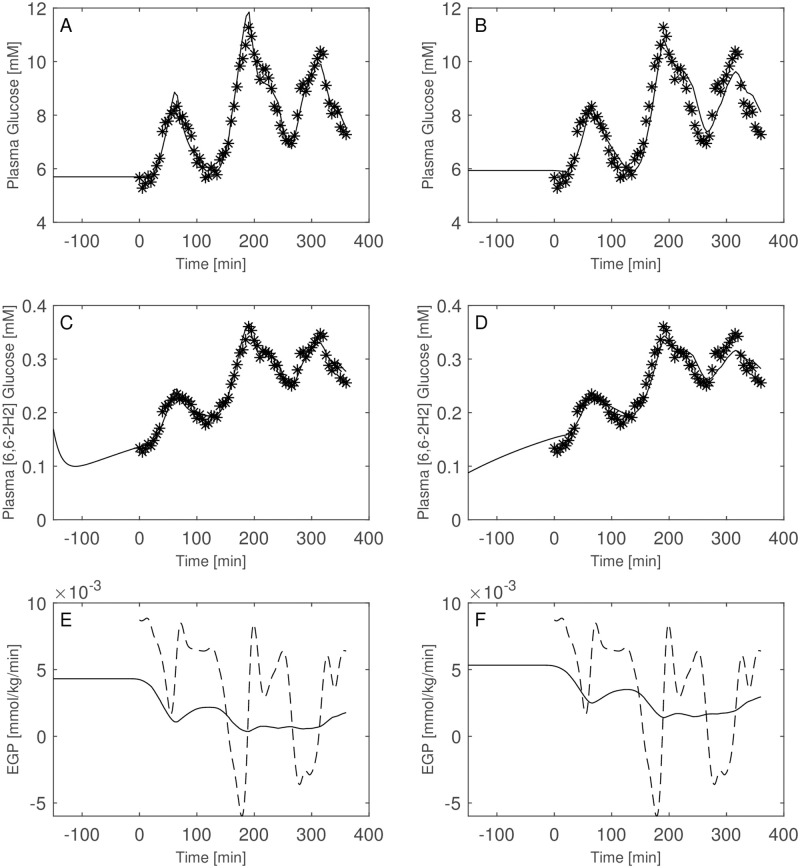
Fig 9. Model comparison for Subject 1.
Observed (asterisks) and predicted (line) variables over time with glucose two-compartment model (Panels A, C, E) and one-compartments-glucose model (Panels B, D, F). Dashed line is the predicted EGP with the Steele model. All the observed points refer to data measured on day 2. Plasma glucose concentrations (panel A) are derived from the glucose intra-venous infusion to match plasma glucose observations from the OGTTs of day 1.

