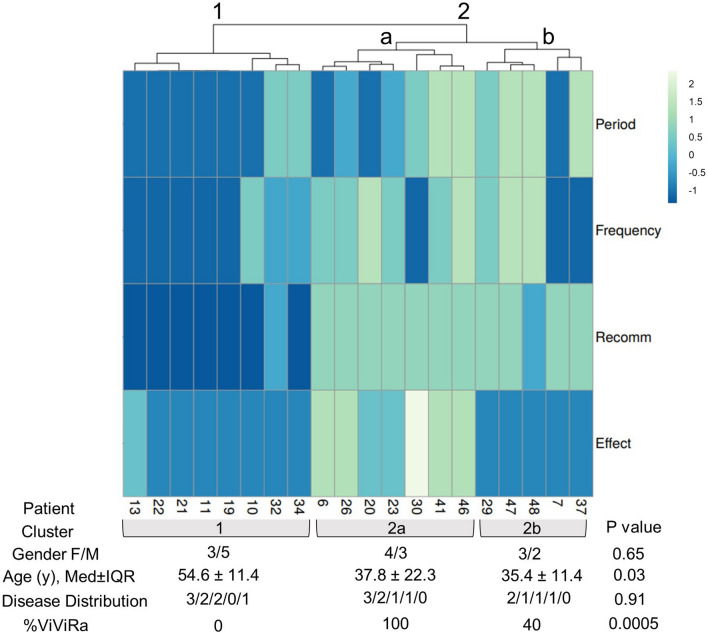
Fig. 4.
Clusters of DTx users. Data were obtained from the interview in a correlation-based hierarchical clustering algorithm to separate different patient groups (online tool ClustVis) (clustering method, columns, and rows: Euclidian; clustering distance, columns, and rows: Ward). Limited clinical data separated by cluster are provided below the heatmap. P values were determined by Kruskal–Wallis test (continuous variables) or the chi-square test (categorical variables). The disease distribution (absolute number of patients) is shown as axSpA/PsA/RA/FM/others. Recomm, Recommendation

