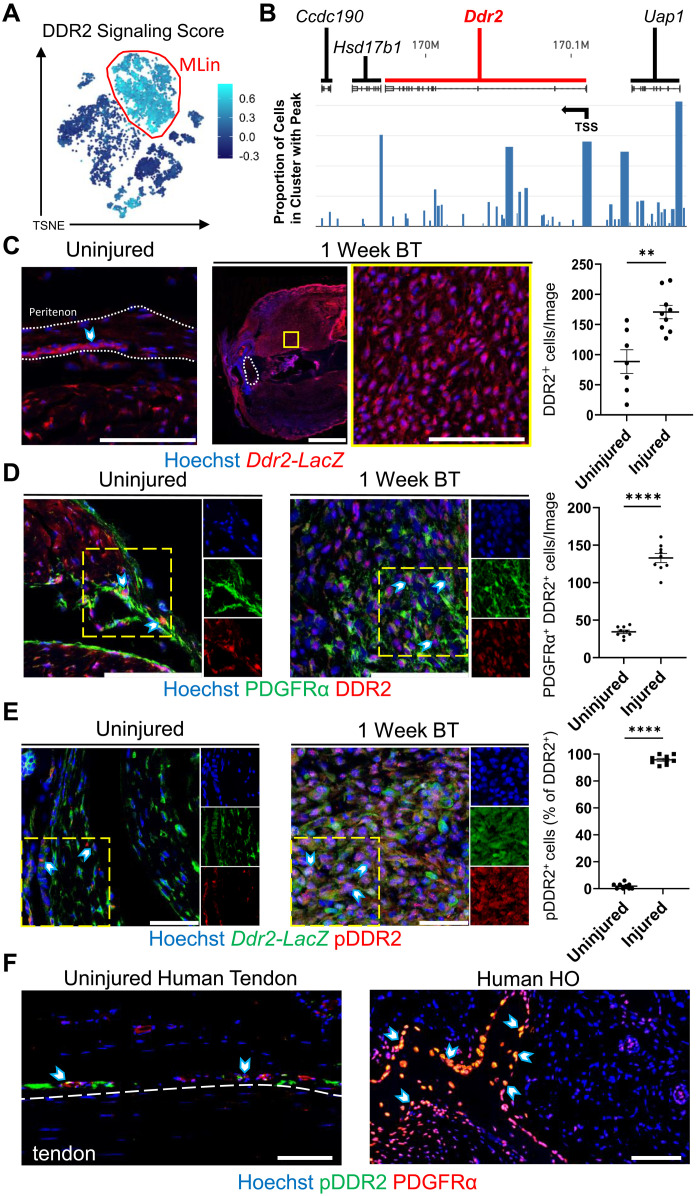
Fig. 2. Ddr2 expression is up-regulated and DDR2 activation increases in MLin cells after injury.
(A) TSNE plot visualizing DDR2 signaling score generated from a list of genes shown to be influenced by Ddr2 activation. (B) snATAC sequencing visualization of Ddr2 and surrounding gene tracks showing the proportion of reads in Pdgfrα-expressing MLin cells 1 week after BT. Arrow labels TSS. (C) Representative confocal images (63×) of uninjured tendon and injury site 1 week after BT in Ddr2-LacZ reporter mice with quantification of the number of β-galactosidase+ cells per image (n = 3 mice per group, n = 2 to 3 images per mouse). The yellow box shows inset region. The region within white outlines is the Achilles tendon. Scale bars on 63× and tile images are 100 and 1000 μm, respectively. (D) Representative confocal images (63×) of uninjured tendon and injury site 1 week after BT in wild-type C57B6 mice with quantification of PDGFRα+ and DDR2+ cells per image (n = 3 mice per group, n = 3 images per mouse). Scale bars, 100 μm. (E) Representative confocal images (63×) of uninjured tendon and injury site 1 week after BT in Ddr2-LacZ mice with quantification of the percentage of β-galactosidase+ cells with pDDR2+ staining per image (n = 3 mice per group, n = 3 images per mouse). Scale bars, 50 μm. (F) Representative confocal images (20×) of uninjured human tendon and mature human HO tissue stained with Hoechst, anti-PDGFRα, and anti-phosphorylated DDR2 (pDDR2). Arrows show PDGFRα+ pDDR2+ cells in peritenon adjacent to uninjured tendon and within and on mature HO tissue. Scale bars, 100 μm. All graphs show means ± SEM. All individual channel images are from the areas within yellow dashes.

