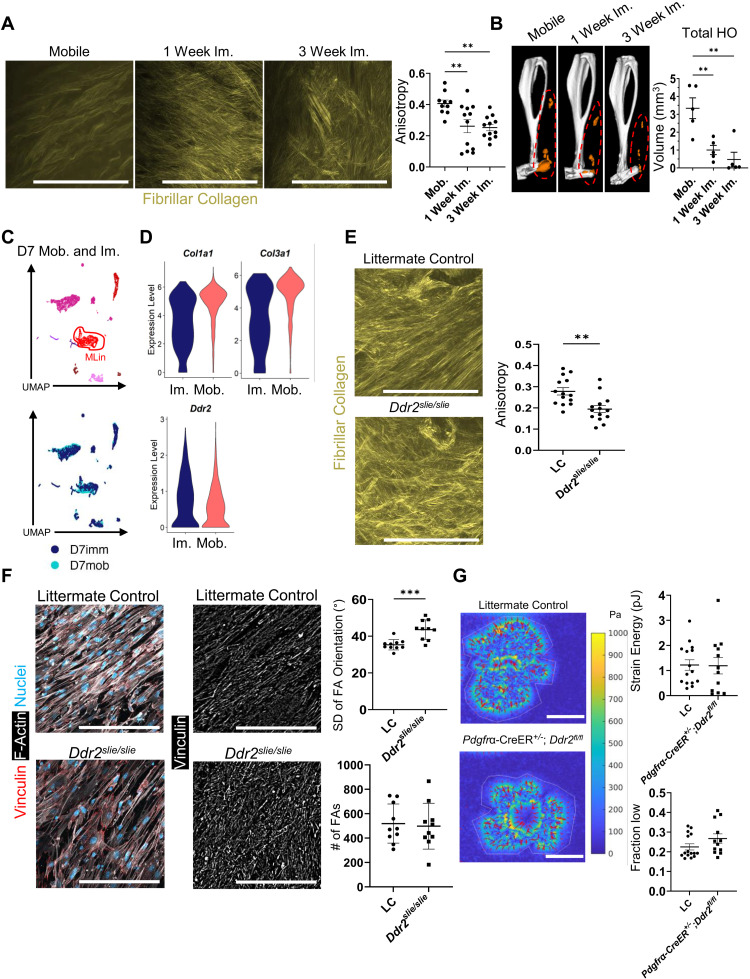
Fig. 4. DDR2 deletion contributes to a disorganized ECM following injury.
(A) SHG imaging of fibrillar collagen at the injury site of wild-type mice—mobilized or immobilized (1 and 3 weeks)—3 weeks after BT. Anisotropy quantification of collagen ECM (n = 3 mice per group, n = 3 to 5 images per mouse). (B) μCT imaging of mobilized or immobilized (1 and 3 weeks) injured hindlimb from wild-type mice 9 weeks after BT (n = 5 mice per group). Orange labels ectopic bone. (C) UMAP dimensional reduction and (D) violin plots showing relative expression of Col1a1, Col3a1, and Ddr2 from scRNA sequencing of cells harvested from the injury site 1 week after BT with and without limb immobilization (n = 1 mouse per group) [Col1a1: average Log(FC) = 0.63, Padj. = 2.88 × 10−100, Col3a1: average Log(FC) = 0.65, Padj. = 4.94 × 10−107, Ddr2: no significant difference]. (E) SHG imaging of fibrillar collagen at the injury site 1 week after BT in LC and Ddr2slie/slie mice (n = 3 mice per group, n = 4 to 5 images per mouse). (F) Representative confocal images (40×) of MLin cells plated on aligned collagen-coated fibrils from LC and Ddr2slie/slie mice and stained with anti-vinculin, phalloidin for F-actin, and Hoechst. Graphs showing number of FAs and SD of FA orientation (n = 10 images per group). (G) Traction force microscopy heatmaps of LC and Pdgfrα-CreER+/−;Ddr2fl/fl MLin cells on 8-kPa type-I collagen–coated substrates. Graphs quantifying strain energy per cell (n = 12 to 15 cells per group) and fraction of cell footprint with low traction, defined as the fraction of region of interest (ROI) area with traction magnitude less than or equal to half of the mean traction magnitude within the ROI area (n = 12 to 15 cells per group; P = 0.0832 by Mann-Whitney U test). All scale bars, 100 μm. All graphs show means ± SEM.

