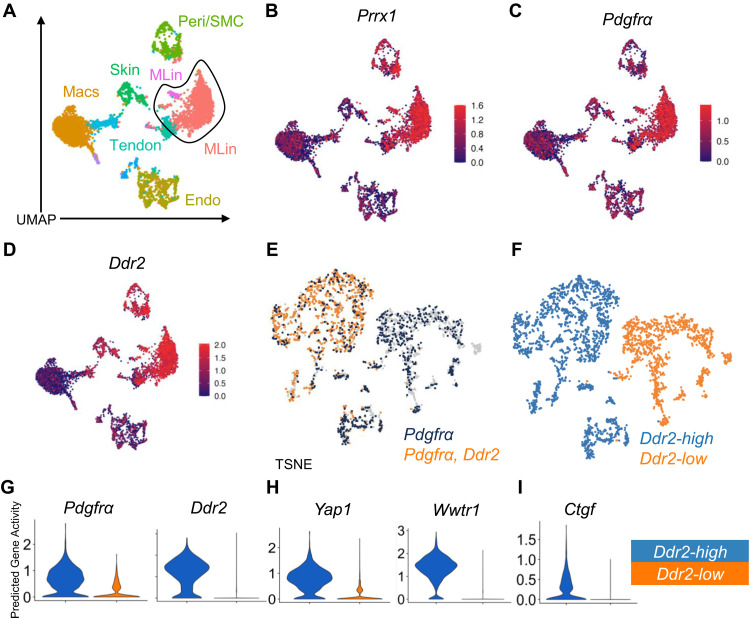
Fig. 5. snATAC analysis shows that the FAK/YAP/TAZ axis is up-regulated following injury in Ddr2-expressing MLin cells.
(A) UMAP plot showing identified cell clusters from snATAC analysis from cells taken from the injury site taken from days 0, 7, and 42 after BT. (B to D) UMAP plots showing predictive gene activity of Prrx1, Pdgfrα, and Ddr2. (E) TSNE plot visualizing coexpression of at least one open chromatin read for Ddr2 and Pdgfrα (orange) overlaid on cells with Pdgfrα open chromatin (navy blue). (F) TSNE plot showing labeling Ddr2-high and -low clusters. (G to I) Violin plots showing predictive gene activity of Pdgfrα, Ddr2, Yap1, Wwtr1, and Ctgf in Ddr2-high and -low clusters.

