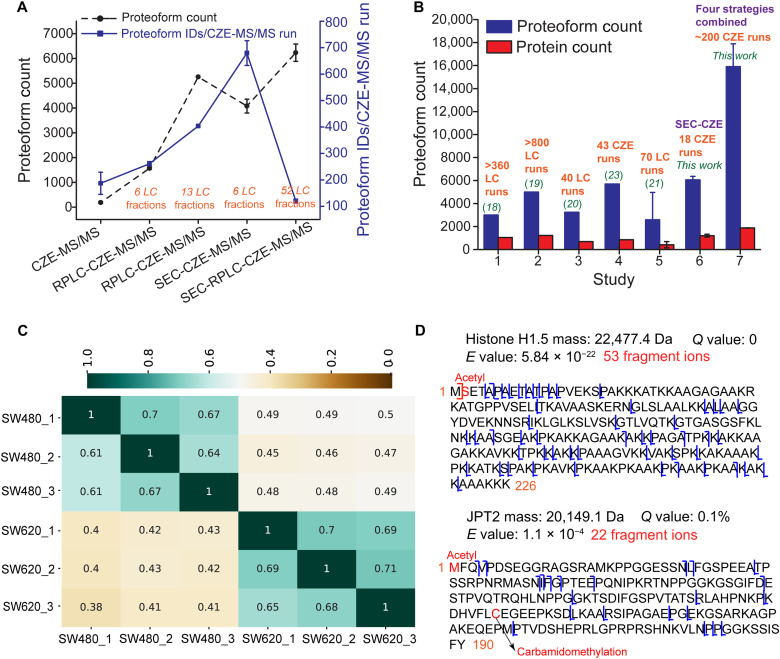
Fig. 2. Summary of proteoform ID results of this study.
(A) Proteoform IDs from SW480 cells using different CZE-MS/MS–based strategies. The error bars represent the SDs of the number of proteoform IDs from technical triplicates. (B) The number of proteoform and protein IDs per complex proteome sample using RPLC- or CZE-MS/MS–based TDP strategies. The data of studies 5 to 7 are shown as means ± SDs from various proteome samples. For example, the mean and SDs of proteoform and protein counts from SW480 and SW620 cells are shown in studies 6 and 7. (C) Heatmap of proteoform overlaps from technical triplicates of SW480 and SW620 cells using SEC-CZE-MS/MS. Each number in the figure represents a ratio between the number of shared proteoforms in two conditions [e.g., SW480_1 (x axis) and SW620_1 (y axis)] and the total number of identified proteoforms in one of the two conditions listed on the y axis (e.g., SW620_1). For example, the proteoform overlap between SW480_1 (x axis) and SW620_1 (y axis) is 0.4, which indicates the ratio between the number of shared proteoforms in those two conditions and the total number of identified proteoforms in SW620_1. (D) Sequences and fragmentation patterns of identified example proteoforms in the study.

