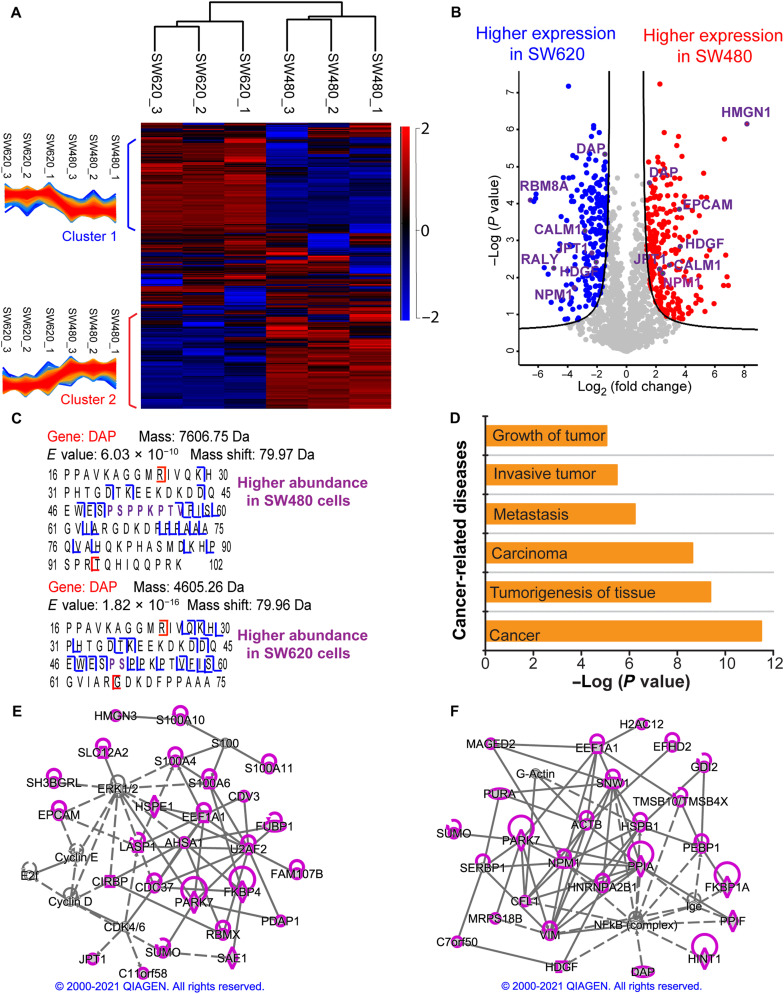
Fig. 5. Summary of the LFQ data of SW480 and SW620 cells from SEC-CZE-MS/MS in technical triplicate.
(A) Heatmap and cluster analysis of the quantified proteoforms (~1500 proteoforms) regarding LFQ intensities. A z-score normalization was used. The red color represents high intensity, and the blue color indicates low intensity. (B) Volcano plot showing differentially expressed proteoforms between the two cell lines. The quantified proteoforms (~1500) were used for the analysis. Red dots and blue dots represent proteoforms having statistically significantly higher abundance in SW480 and in SW620, respectively. Gene names of some differentially expressed proteoforms are labeled. The Perseus software was used for generating the heatmap in (A) and volcano plot in (B) with the following settings (S0 = 1 and FDR = 0.05) (49). (C) Sequences and fragmentation patterns of two phosphorylated proteoforms of the gene DAP. One has higher abundance in SW480 cells, and the other has higher expression in SW620 cells. (D) An IPA analysis reported some cancer-related diseases that are related to the differentially expressed genes in the two cell lines. Proteoforms with higher abundance in SW480 cells (E) or higher abundance in SW620 cells (F) correspond to genes that are involved in cancer-related networks with high scores. Those genes are highlighted in purple. The diamond, oval, hexagon, trapezium, square, and circle shapes represent enzyme, transcription regulator, translation regulator, transporter, growth factor, and others. The solid and dotted lines represent direct and indirect interactions. Copyright permission has been granted by QIAGEN for using the network data.

