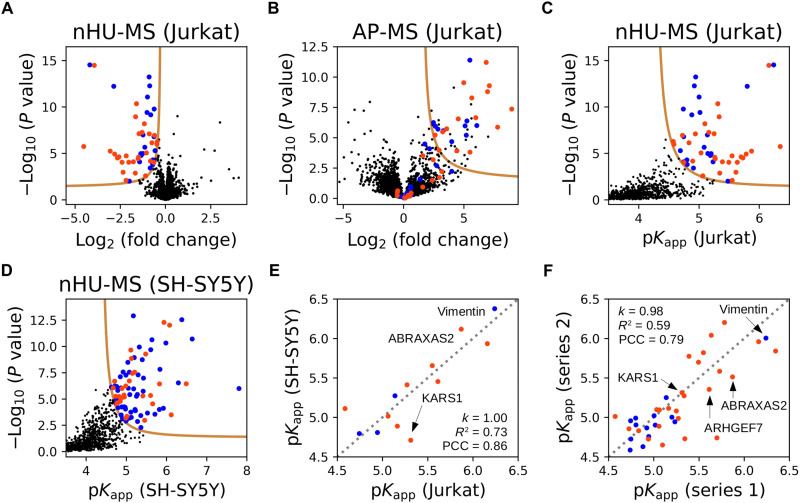
Fig. 3. nHU-MS to survey affinities of the SNX27 PDZ domain proteome-wide.
(A) Volcano plot of the nHU-MS experiment performed with SNX27_PDZ bait on total Jurkat extracts (n = 6). Identified interaction partners with or without C-terminal putative PBMs are colored with orange or blue, respectively. (B) Volcano plot of the control pull-down experiment performed on the leftover resin of the nHU experiment (n = 6). Preys are colored according to their coloring on (A). (C and D) Converted affinities of nHU experiments measured with Jurkat (C) or SH-SY5Y (D) extracts. (A to D) P values were calculated using a two-sided unpaired t test for nHU-MS and AP-MS experiments. The statistical significance thresholds for binding (tan lines) were determined at 1 σ and P value < 0.05. (E) Correlation between apparent affinities of SNX27_PDZ measured with Jurkat or SH-SY5Y extracts. (F) Correlation between apparent affinities of SNX27_PDZ measured in two independent experiment series using Jurkat extracts. The second experiment series was measured on a different MS instrument using different number of replicates (n = 3). Direct proportionality was assumed between affinities, and the coefficient of proportionality (k), R2 values, and PCC values are indicated in (E) and (F). Gray dashed line indicates the diagonal in (E) and (F). See fig. S3 and table S1 for additional data.

