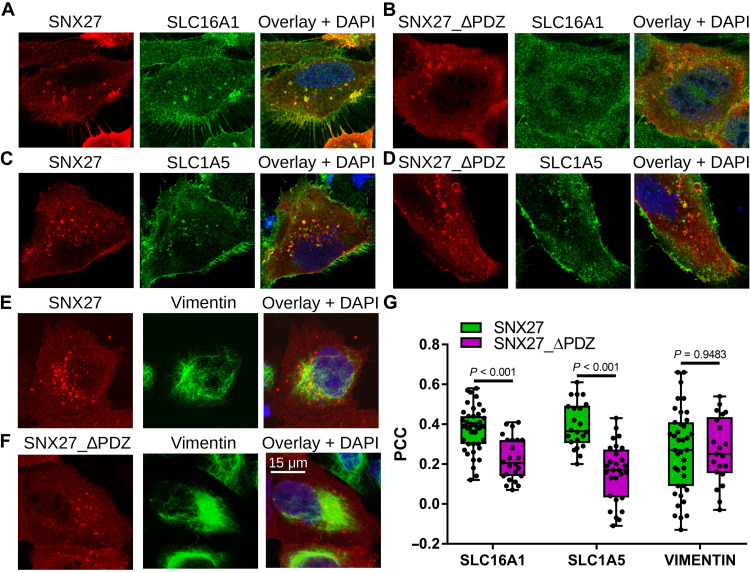
Fig. 6. Colocalization of SNX27 and SNX27_∆PDZ with selected partner proteins identified with nHU.
(A to F) Representative colocalization images of U2OS cells expressing hemagglutinin (HA)–tagged SNX27 (A, C, and E) or HA-tagged SNX27_ΔPDZ (B, D, and F) stained with anti-HA antibody (red) and antibodies against endogenous SLC16A1 (A and B), SLC1A5 (C and D), or Vimentin (E and F) (green), and with DAPI (blue). Confocal images are shown for the two transmembrane SLC transporters, and a maximum intensity projection is shown for Vimentin. (G) Colocalization was quantified on confocal images for each transfected cell (n > 20) by measuring intensity correlation (PCC). Box plots indicate the median and upper and lower quartiles, and whiskers label the minimal and maximal measured PCC values. Individual data points representing measurements of single cells are also indicated. P values were calculated using two-sided unpaired t tests. See fig. S7 for additional confocal images.

