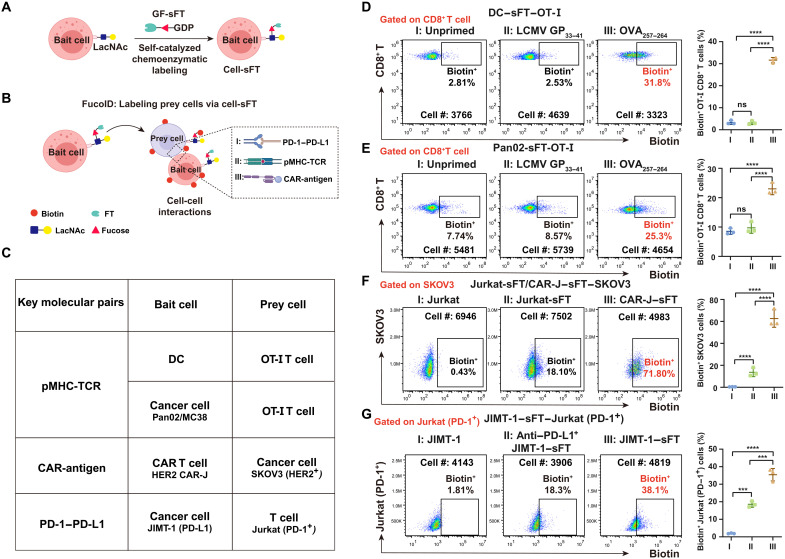
Fig. 3. Expansion of the CCI systems studied by FucoID under the control of different molecular pairs.
(A and B) Schematic illustration of cell-sFT–based FucoID system for detecting of CCIs. (C) A list of the CCIs evaluated. FT was installed onto bait cells. Key molecular pairs designate the molecules directing the interaction. (D and E) DC-sFT and Pan02-sFT cells were primed by OVA257–264 to interact with the cognate OT-I T cells. Flow cytometry–based quantification of antigen-specific Fuc-biotin of CD8+ T cells by DC-sFT (D) or Pan02-sFT (E) primed with OVA257–264 in OT-I splenocytes. n = 3. Interaction time, 2 hours; labeling time, 30 min. The background is defined as the signal produced on OT-I CD8+ T cells when incubated with DC or Pan02 without membrane-anchored sFT. (F) Flow cytometry–based quantification of interaction-dependent fucosyl-biotinylation of HER2+ SKOV3 cells using Jurkat, Jurkat-sFT, and CAR-J–sFT. n = 3. Interaction time, 1 hour; labeling time, 30 min. The background is defined as the signal produced on SKOV3 incubated with Jurkat without membrane-anchored sFT. (G) Flow cytometry–based quantification of interaction-dependent Fuc-biotin of Jurkat–PD-1 cells using JIMT-1–sFT (PD-L1+) with or without PD-L1 blockade treatment. n = 3. Interaction time, 1 hour; labeling time, 30 min. The background is defined as the signal produced on Jurkat incubated with JIMT-1 without membrane-anchored sFT. n, number of biological repeats. ns, P > 0.05; ***P < 0.001; ****P < 0.0001.

