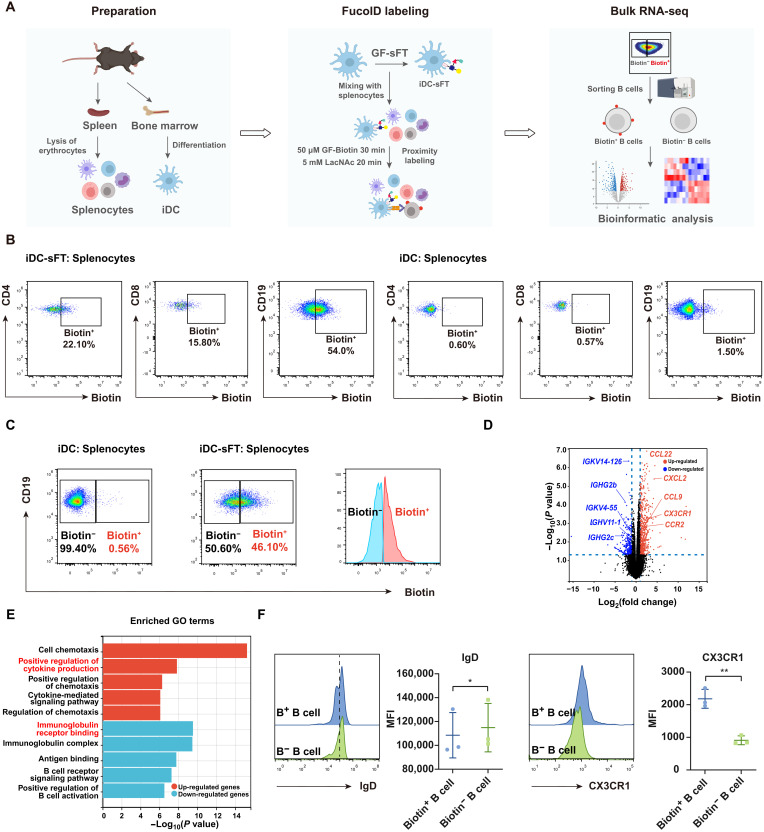
Fig. 5. Use of the iDC-sFT probe to identify DC–B cell interactions in splenocytes.
(A) Schematic workflow for the preparation, labeling and analysis of splenocytes interacting with iDCs. (B) Representative flow cytometric plots showing the fucosyl-biotinylation of CD4+ T cells, CD8+ T cells, and B cells in splenocytes mediated by iDC-sFT and iDCs. iDC-sFT or iDCs were mixed with splenocytes under 50 μM GF-Biotin for 30 min. The background is defined as the signal produced on splenocytes by incubating iDCs with splenocytes. (C) Flow cytometric gating strategy for isolating Biotin+ (interacting) and Biotin− (bystander) B cells via fluorescence-activated cell sorting (FACS). (D) Volcano plots of differentially expressed genes between Biotin+ and Biotin− B cells. n = 4. Membrane protein related genes are highlighted. (E) GO terms enriched by the up-regulated and down-regulated genes between Biotin+ and Biotin− B cells. Bar represents the P value. n = 4. (F) Representative flow cytometric histograms and statistics showing IgD and CX3CR1 expressions on Biotin+ (B+) and Biotin− (B−) B cells. MFI, mean fluorescence intensity. *P < 0.05; **P < 0.05.

