. 2022 Dec 8;11:e77603. doi: 10.7554/eLife.77603

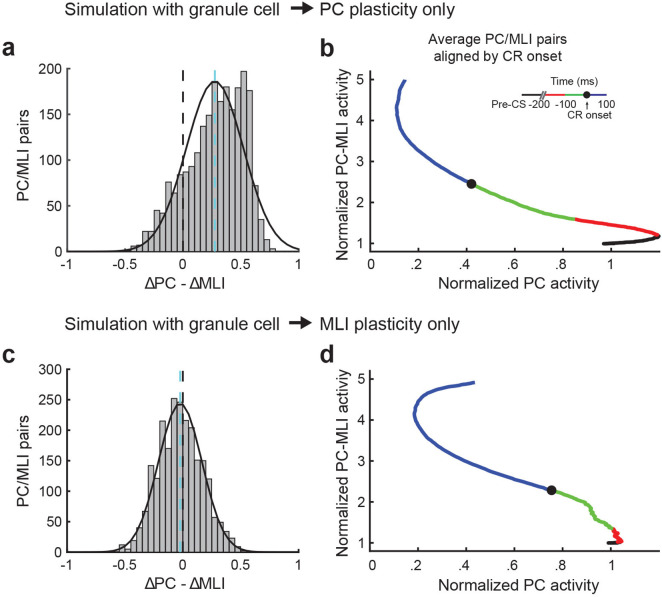
Figure 10. Relationship between the responses of simultaneously recorded eyelid PC-MLIs and eyelid PCs and conditioned eyelid responses.

Distribution showing relationship between timing of decreases in eyelid PCs activity and increases in PC-MLIs activity at each interstimulus interval (ISI) (black = ISI 250, 76 PC/PC-MLI pairs; blue = ISI 500, 50 pairs; red = ISI 700 and 750, 10 pairs). The mean of the distribution of ∆PC − ∆MLI differences is indicated with a white dashed line. This distribution is shifted (arrow) to the right of 0 (black dashed line), indicating that the PC activity decreases more rapidly than the PC-MLI activity increases, relative to CR onset, for most pairs of neurons. MLIs, molecular layer interneurons; PC, Purkinje cell.
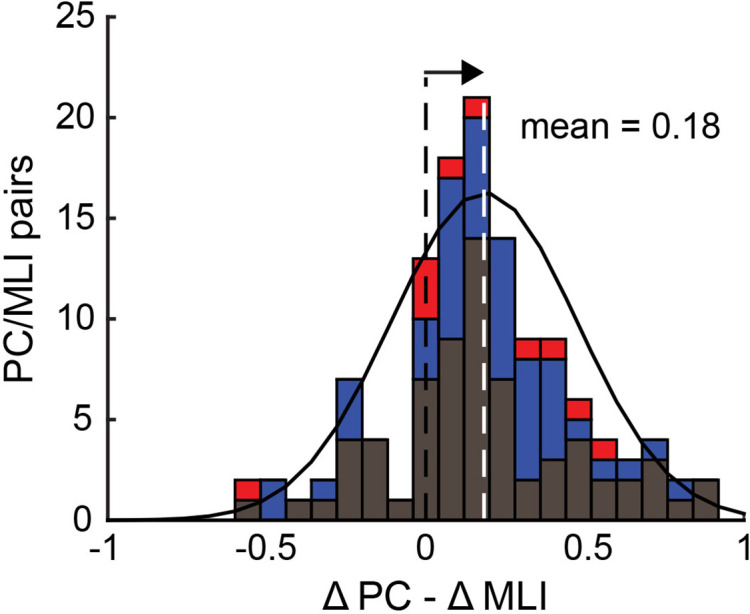
Figure 10—source data 1. Source files for ∆PC-∆MLI distribution between the responses of simultaneously recorded eyelid PC and eyelid PC-MLI during eyelid conditioning at different interstimulus intervals (ISIs).
Full and preCR PC normalized firing rate decrease (∆PC = preCR/full PC activity decrease) and full and preCR MLI normalized firing increase (∆MLI = preCR/full MLI activity increase) were measured to access the timing of PC and PC-MLI activity changes in recorded pairs (∆PC-∆MLI; see Figure 9—figure supplement 2b). MLI, molecular layer interneuron; PC, Purkinje cell.

Figure 10.

Figure 10—figure supplement 1. Relationship between activity of Purkinje cell (PC) and PC-MLI pairs from simulations featuring different sites of circuit plasticity.

Figure 10—figure supplement 1.

(a) Distribution of the relative latency of eyelid PCs decreases in activity relative to increases in PC-MLIs (ΔPC – ΔMLI) in simulations with plasticity only at granule cell-to-PC synapses. The distribution of ΔPC – ΔMLI differences (mean indicated by cyan dashed line) is shifted to the right of zero (black dashed line), indicating that PC activity usually decreases more than the PC-MLI activity increases relative to conditioned response onset. (b) Plots of the time of average normalized activity for all eyelid PC/PC-MLI pairs from the simulation with plasticity only at granule cell-to-PC synapses, aligned to response onset (black dot). Green represents 100 ms before response onset and blue represents 100 ms after response onset in each case (inset). PC activity tended to decrease before the time of conditioned response (CR) onset and then continued to decrease after CR onset, while the PC-MLI activity increased later. This was similar to the trend observed in vivo, as shown in Figure 9—figure supplement 2a. (c) Same distribution as in (a), from a simulation with plasticity only at granule cell-to-MLI synapses. (d) Same analysis as in (b), for the results of simulation with plasticity only at granule cell-to-MLI synapses. The trend was for the PC-MLI to increase its activity before CR onset and the PC to then decrease its activity after CR onset. MLI, molecular layer interneuron.