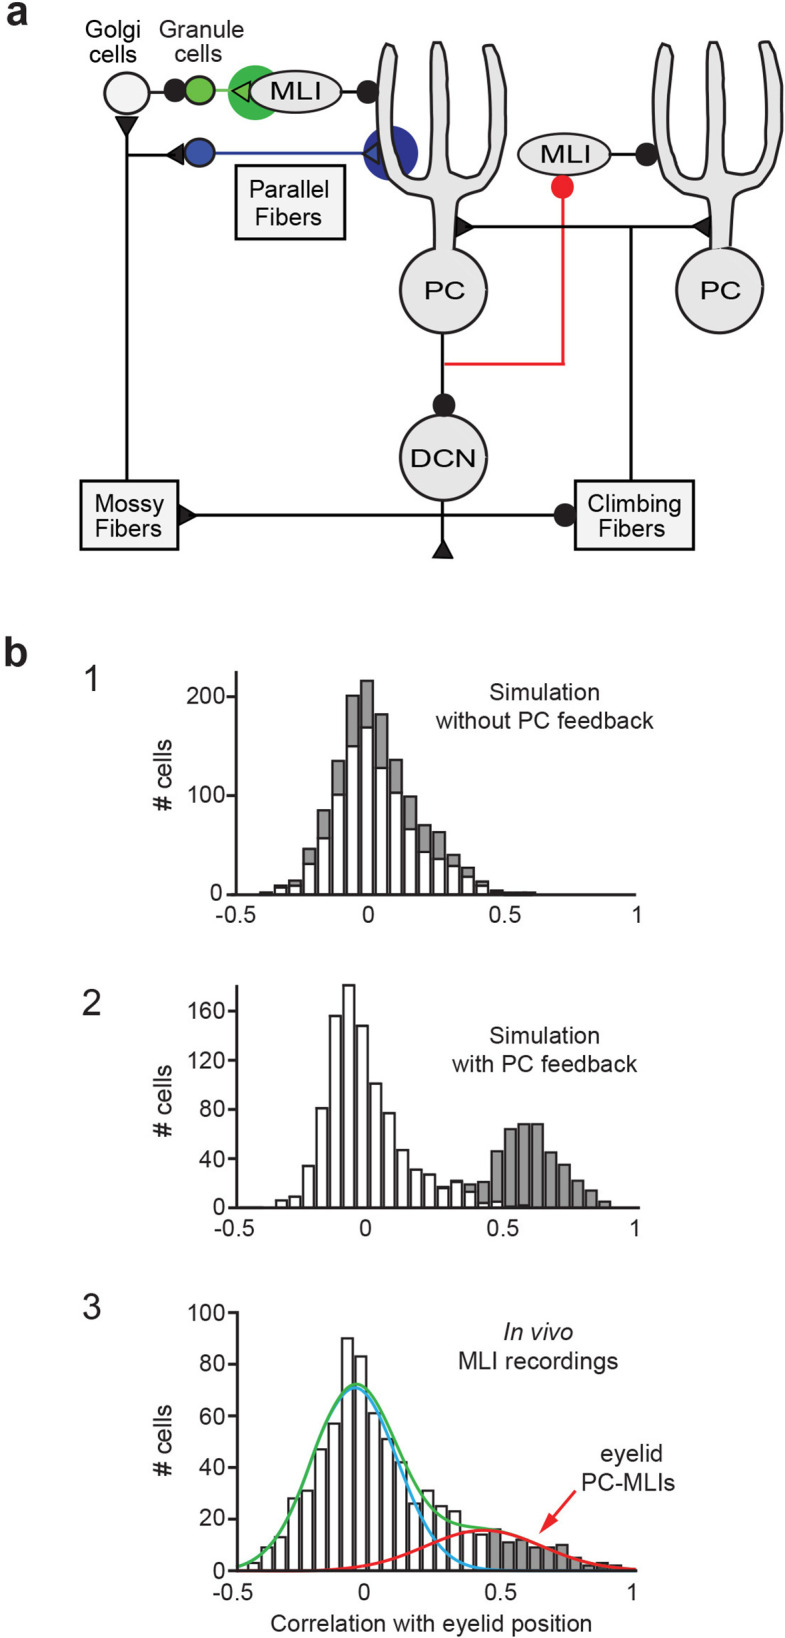
Figure 5. Relationship between molecular layer interneuron (MLI) activity and eyelid conditioning behavior.

(a) Circuit diagram showing main connections and sites of plasticity for the computer simulation of the cerebellum. Green indicates potential plasticity at granule cell-to-MLI synapses and blue indicates plasticity at granule cell-to-PC synapses. Red indicates the inhibitory feedback connection from PCs to MLIs that is the main focus of our paper. (b) Cross-correlations between MLI activity and eyelid conditioned responses (CRs). The top two panels show data from a computer simulation of the cerebellum. In well-trained simulations, correlations were calculated between MLI activity and the predicted CRs. (1) The simulation without feedback from PCs to MLIs yielded a distribution of correlations centered around zero for all MLIs (white bars indicate stellate cells and gray bars indicate basket cells). (2) Simulations with PC-to-MLI feedback exhibited two distributions, one from a subset of MLIs that is shifted in the positive direction (gray bars) and the other centered around zero (white bars). (3) Distribution of correlations between CRs and MLI activity recorded in vivo for all interstimulus intervals (ISIs) can be fit with two distributions, one shifted in the positive direction (red curve) and one centered around zero (blue curve) similar to the simulation with the PC to MLI feedback. The cutoff for categorizing an MLI as a PC-MLI (gray bars) was a correlation coefficient ≥0.43, which represents the point where there was a 0.95 probability that the two fitted distributions were different. PC, Purkinje cell.
