. 2022 Dec 8;11:e77603. doi: 10.7554/eLife.77603

Figure 6. Changes in Purkinje cell (PC) and PC-MLI activity correlated with eyelid position during eyelid conditioning.

(a) (1) Eyelid movements (vertical) in response to conditioned stimuli (CS; tone) and unconditioned stimuli (US; eyelid stimulation), sorted by the latency of the conditioned response (CR; red points). Upward deflection indicates eyelid closure, with closure indicated by dark gray lines reflecting CRs. (2) Peri-stimulus time histogram (top; 10 ms bins) and raster plot (bottom) of an eyelid PC recording from all trials of the eyelid conditioning session shown at left. For this and all subsequent raster plots, the gray bar under the plot indicates duration of the CS and the black bar indicates the duration of the US. (b) Peri-stimulus time histogram (top; 10 ms bins) and raster plot (bottom) of a recording from a putative PC-MLI (2), along with the behavior from all trials of the eyelid conditioning session during the recording (1), sorted by the latency of the CRs (red points). (c) Examples of the wide range of MLI responses observed in vivo during CRs. Peri-stimulus time histograms (10 ms bins) and raster plots sorted by response latency (red points) for three MLIs. Example 1 is from the low-correlation (r=0.20) part of the distribution shown in Figure 5b3. Examples 2 (r=0.46) and 3 (r=0.91) were operationally defined as eyelid PC-MLIs due to their high correlation with CR behavior. MLI, molecular layer interneuron.

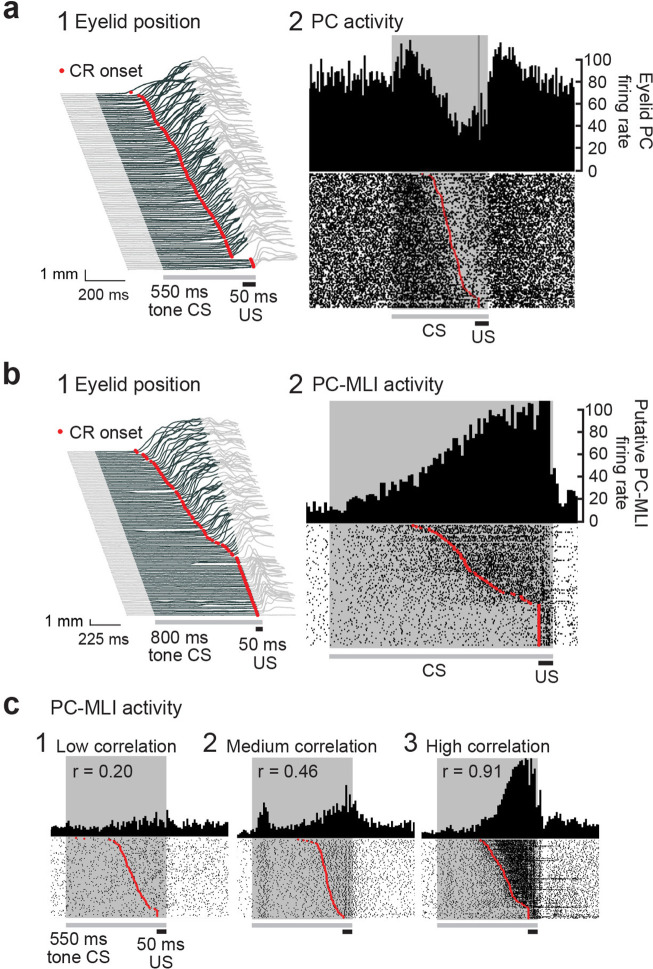
Figure 6.

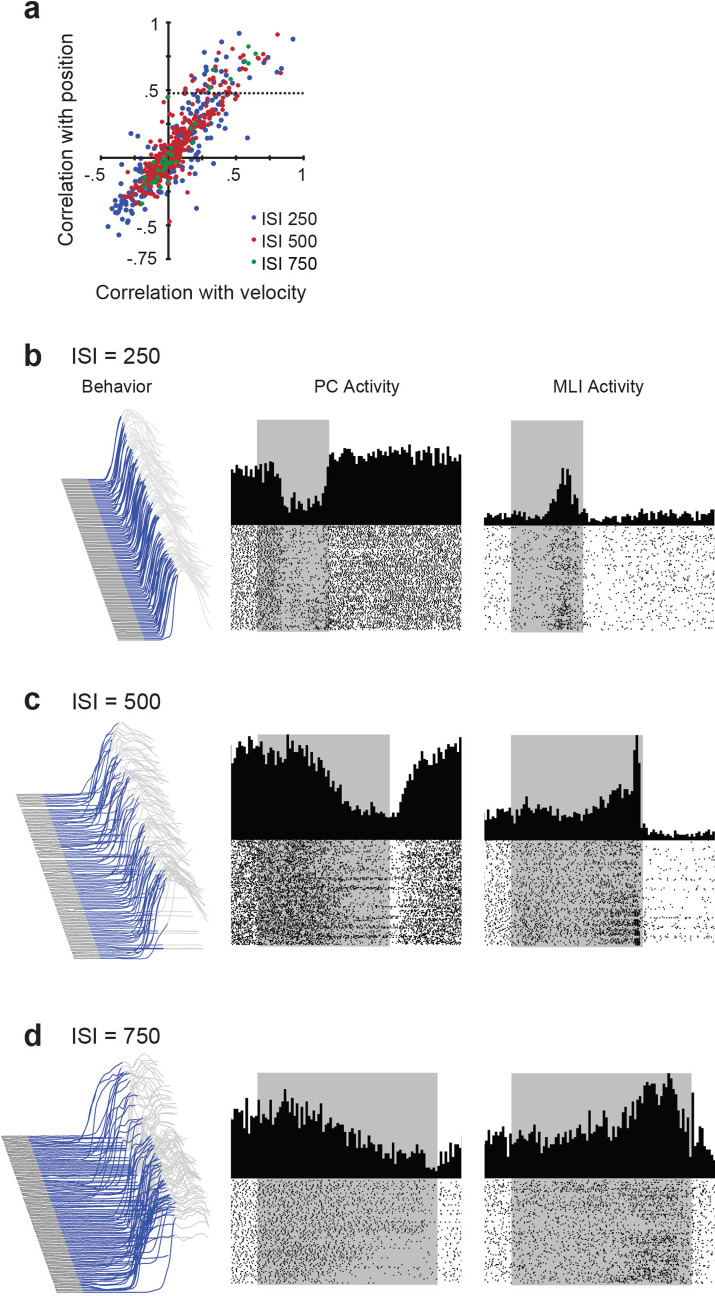
Figure 6—figure supplement 1. Relationship between simultaneously recorded activity of eyelid molecular layer interneurons (MLIs) and eyelid Purkinje cells (PCs) and conditioned eyelid responses.

Figure 6—figure supplement 1.

(a) Scatter plot obtained from for all MLI recordings showing the cross-correlation between MLI activity and either eyelid position or velocity at three different interstimulus intervals (ISIs). Very few MLIs correlated more highly with velocity than position. All correlations above the dotted horizontal line (correlation of 0.43) were classified as putative eyelid PC-MLIs. (b–d) Eyelid movements and the activity of a PC and a putative PC-MLI simultaneously measured at different ISIs. Left – Eyelid movement during a conditioning session. Blue area indicates the duration of the tone stimulus (conditioned stimulus) and upward deflection is the conditioned response of the eyelid. Center – Peri-stimulus time histograms and raster plots of eyelid PC activity measured during the session shown at left. Right – Peri-stimulus time histograms and raster plots of putative eyelid PC-MLI activity measured during the same session. These are the same data shown in Figure 9a and b and are shown here to illustrate how trial-to-trial variability in conditioned response timing can obscure the appearance of the tight relationship between eyelid MLIs and PCs; this relationship becomes clear once the data are sorted by time of onset of the conditioned response, as in Figure 9a and b.