
Figure 8. Temporal relationship between connected Purkinje cells (PCs) and putative PC-MLIs.
(a and b) Average cross-correlograms calculated from significantly modulated pairs of MLIs and eyelid PCs. Background activity of putative PC-MLI is triggered off PC simple spikes (vertical red line), for PC-MLI and PC pairs recorded on the same tetrode (a) and from the computer simulation (b). Decrease in MLI activity after a PC simple spike indicates an inverse relationship between the activity of the two cell types. (c and d) Average PC pause-triggered (c) and burst-triggered (d) cross-correlograms of putative PC-MLI background activity. Plots show average PC-MLI activity across significant pairs recorded on the same tetrode. Pauses in PC simple spikes resulted in an increase in mean PC-MLI activity, while bursts of PC simple spikes resulted in a decrease in mean PC-MLI activity. MLIs, molecular layer interneurons.
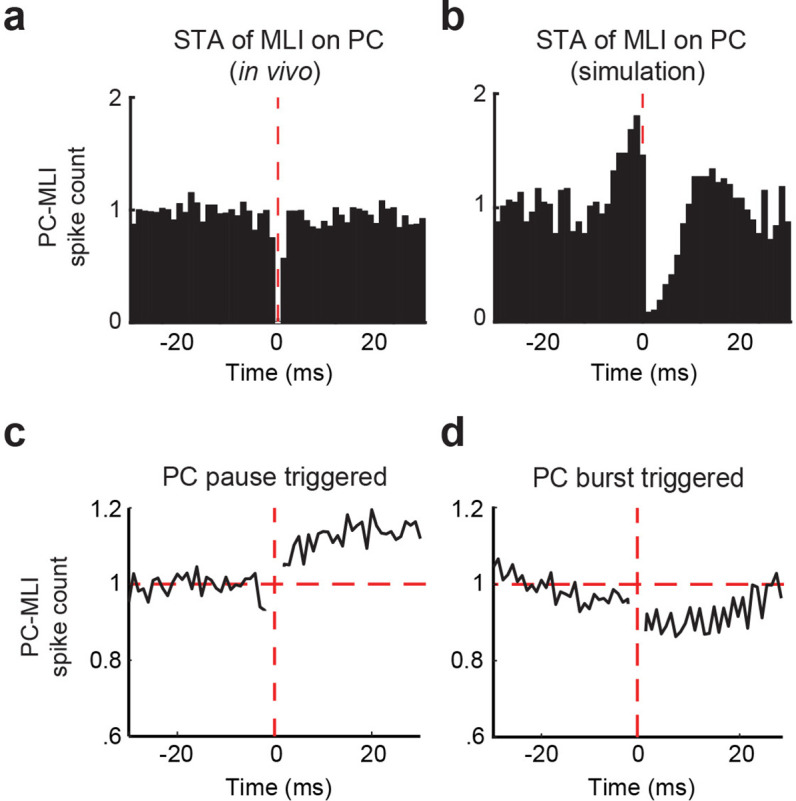
Figure 8—figure supplement 1. Relationship between baseline activity of PC-MLIs and PCs simultaneously recorded from the same tetrode.
