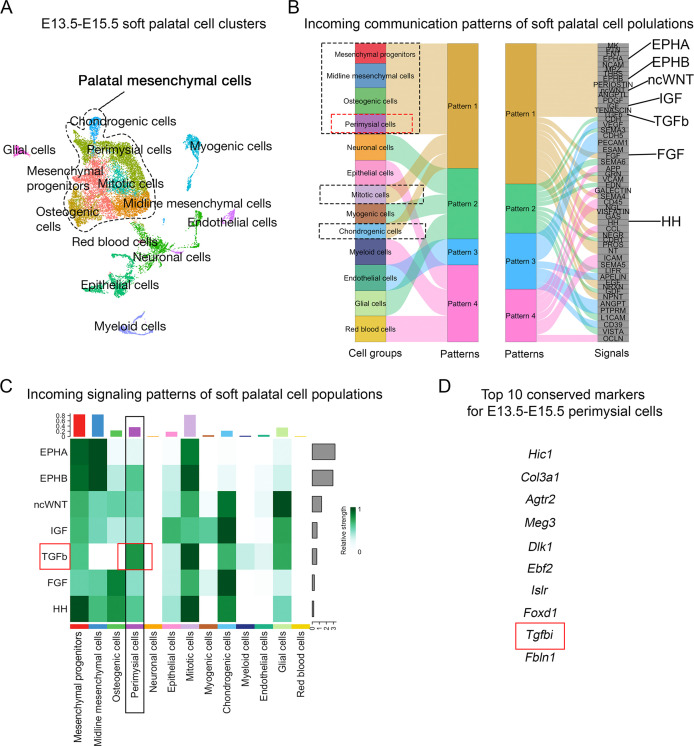
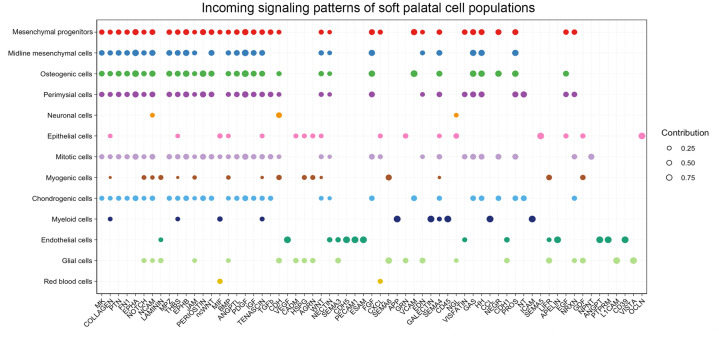
Figure 1. CellChat analysis of E13.5-E15.5 soft palatal scRNAseq data predicts TGF-β signaling as a key pathway activated in the perimysial cells.
(A) UMAP plot of soft palatal cell populations identified by Seurat integration analysis. (B) Alluvial plot of the incoming signaling patterns for soft palatal cell populations. The black dotted boxed area indicates the palatal mesenchymal cell populations grouped into the same incoming patterns. The red dotted box highlights the perimysial cells. (C) Heatmap of the contribution of the incoming pathways of interest to soft palatal cell populations. The black box highlights signaling activity in the perimysial cells and the red box highlights TGF-β signaling activity in the perimysial cells. (D) Top conserved markers for perimysial cells identified through Seurat integration analysis.


