. 2022 Dec 21;11:e80405. doi: 10.7554/eLife.80405

Figure 7. Myogenic cells are reduced in the LVP region of Osr2Cre;Fgf18fl/fl mice, while Fgf18 increases MyoD+ myogenic cells in Osr2Cre;Tgfbr1fl/fl soft palate slice cultures.

(A–L) H&E staining in coronal sections of LVP region at P0.5 from control and Osr2Cre;Fgf18fl/fl mice. Boxed areas in A-D and E-H are enlarged in E-H, and I-L, respectively. Black arrows point to the palatal shelf in A-D and the LVP in E-H. Green dotted line outlined the LVP in E-H. Black and white triangles point to perpendicular muscle fibers in I-L and parallel fibers in I-J. The white dotted line indicates the boundaries of perpendicular and parallel fibers in E, F, I, and J. Double-ended arrows indicate the thickness of perpendicular fibers in I and J. N=4. (M–Q) Immunofluorescence and quantification of MHC (red) staining on coronal section of the LVP region of control Osr2Cre;Fgf18fl/fl mice at P0.5. MHC+ areas in the LVP region for quantification of cross-section areas are outlined by white dashed lines in M-P. The percentage of MHC-stained area out of the whole image area is used for quantification in Q. *, p≤0.05. N=3. Statistical significance was assessed by unpaired t-test with two-tailed calculations. Data is presented as mean ± SEM. (R–V) CT scanning and quantitative analysis of the muscle volume of control and Osr2Cre;Tgfbr1fl/fl LVP at P0.5. A representative reconstructed control LVP from CT scanning is indicated in yellow (R and S) and an Osr2Cre;Tgfbr1fl/fl reconstructed LVP is indicated in teal (T and U). **, p≤0.01. N=4. Statistical significance was assessed by unpaired t-test with two-tailed calculations. Data is presented as mean ± SEM. (W) A 300 μm coronal slice of the LVP region at E14 from Osr2Cre;Fgf18fl/fl mouse for slice culture following bead implantation. Arrows point to BSA- or FGF18-treated bead. (X–Y) Immunofluorescence of MyoD (red) in the coronal section of LVP region from Osr2Cre;Fgf18fl/fl mouse cultured for 3 days with BSA bead (X) and FGF18 bead (Y). White circles indicate the location of the BSA beads in X and FGF18 beads in Y. N=3. Fgf18fl/fl or Fgf18fl/+ littermates were used as controls for Osr2Cre;Fgf18fl/fl mice. Scale bars in A, E, I, M, R, S, and W indicate 500 μm in in A-D, 100 μm in E-H, 50 μm in I-L, 400 μm in M-P, 400 μm in R and T, 100 μm in S and U, and 100 μm in W-Y, respectively.

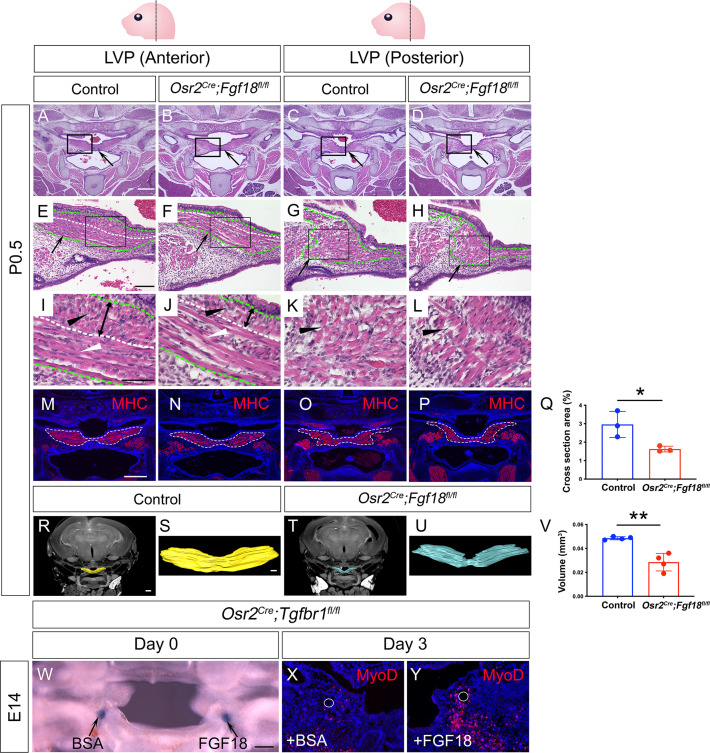
Figure 7—source data 1. Source data for Figure 7Q.
Figure 7—source data 2. Source data for Figure 7V.

Figure 7.

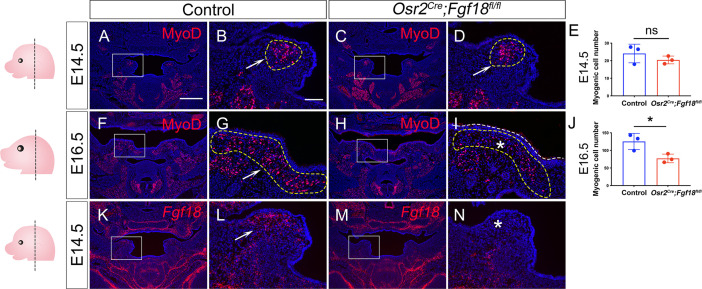
Figure 7—figure supplement 1. Osr2Cre;Fgf18fl/fl mice exhibit myogenic defects during LVP development.

Figure 7—figure supplement 1.

(A–J) Immunofluorescence and quantification of MyoD (red) in coronal section of LVP region at E14.5 (A–E) and E16.5 (F–J) from control and Osr2Cre;Fgf18fl/fl mice. Boxed areas in A, C, F, and H are enlarged in B, D, G, and I, respectively. White arrows in B, D, and G point to the presence of MyoD+ cells. The white asterisk in I indicates a decrease of MyoD+ cells in E16.5 Osr2Cre;Fgf18fl/fl mice. Note that the myogenic cell numbers in E14.5 are comparable between control and Osr2Cre;Fgf18fl/fl mice at E14.5 (E) but are significantly decreased in the mutant at E16.5 (J). *, p≤0.05; ns, not significant. Statistical significance was assessed by unpaired t-test with two-tailed calculations. Data is presented as mean ± SEM. Yellow dotted line outlines the myogenic regions where the qualification analysis was performed. (K–N) BaseScope in situ hybridizations of Fgf18 Exon1C (red) in the coronal section of LVP region at E14.5 from control and Osr2Cre;Fgf18fl/fl mice. Boxed areas in K and M are enlarged in L and N, respectively. The white arrow in L points to a positive signal, and the asterisk in N points to a reduced signal. Left panel schematics depict the orientation and level of the sections. N=3 for all experiments. Fgf18fl/fl or Fgf18fl/+ littermates were used as controls for Osr2Cre;Fgf18fl/fl mice. Scale bar in A indicates 500 μm in A, C, F, H, K, and M; scale bar in B indicates 100 μm in B, D, G, I, L, and N.
Figure 7—figure supplement 1—source data 1. Source data for Figure 7—figure supplement 1E.
Figure 7—figure supplement 1—source data 2. Source data for Figure 7—figure supplement 1J.
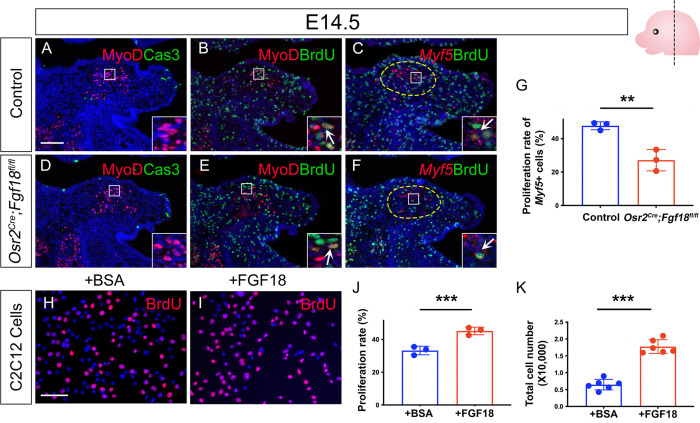
Figure 7—figure supplement 2. Loss of Fgf18 in Osr2Cre;Fgf18fl/fl mice leads to defective proliferation of Myf5+ myogenic cells during LVP development, while exogenous FGF18 can increase the proliferation of C2C12 myogenic cells.

Figure 7—figure supplement 2.

(A–F) Immunofluorescence and RNAScope in situ hybridization for MyoD (red) and Caspase 3 (A and D), MyoD (red) and BrdU (green) (B and E), and Myf5 (red) and BrdU (green) (C and F) in coronal sections of LVP region at E14.5 from control and Osr2Cre;Fgf18fl/fl mice. Insets are enlarged from the boxed areas. Yellow dotted line outlines the myogenic regions where the qualification analysis was performed. N=3. Fgf18fl/fl or Fgf18fl/+ littermates were used as controls for Osr2Cre;Fgf18fl/fl mice. The schematic in the top right corner depicts the orientation and level of the section. (G) Quantification of the percentage of BrdU+/My5 + double-positive cells out of the total Myf5 + cells in the LVP region from E14.5 control and Osr2Cre;Fgf18fl/fl mice. **, p≤0.01. N=3. Statistical significance was assessed by unpaired t-test with two-tailed calculations. Data is presented as mean ± SEM. (H–J) Immunofluorescence and quantification of BrdU (red) staining on C12C12 myogenic ells following 1 day of treatment with BSA or 500 ng/ml FGF18. Proliferative rate is calculated by the percentage of BrdU+ cells out of the total number of cells. ***, p≤0.001. N=3. Statistical significance was assessed by unpaired t-test with two-tailed calculations. Data is presented as mean ± SEM. (K) Quantification of total number of C12C12 myogenic cells after culture for 3 days with BSA or 500 ng/ml FGF18. ***, p≤0.001. N=6. Statistical significance was assessed by unpaired t-test with two-tailed calculations. Data is presented as mean ± SEM. Scale bar in A indicates 100 μm for A-F and 30 μm for the insets in A-F; scale bar in H indicates 200 μm for H-I.
Figure 7—figure supplement 2—source data 1. Source data for Figure 7—figure supplement 2G.
Figure 7—figure supplement 2—source data 2. Source data for Figure 7—figure supplement 2J.
Figure 7—figure supplement 2—source data 3. Source data for Figure 7—figure supplement 2K.