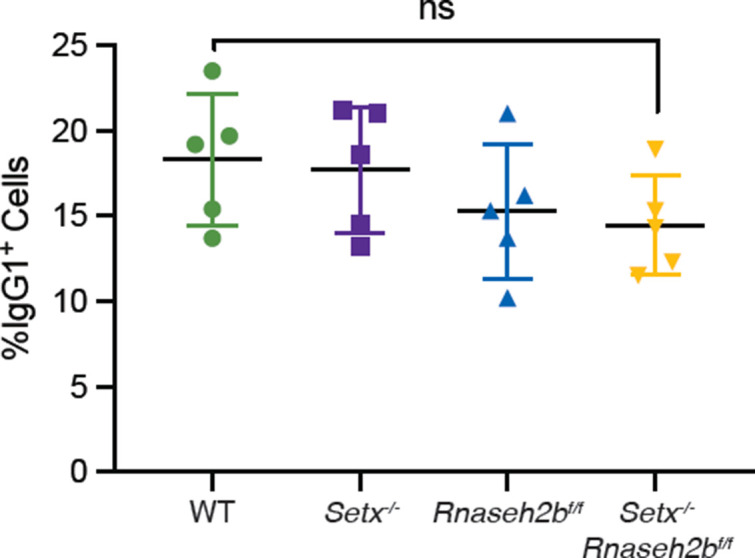
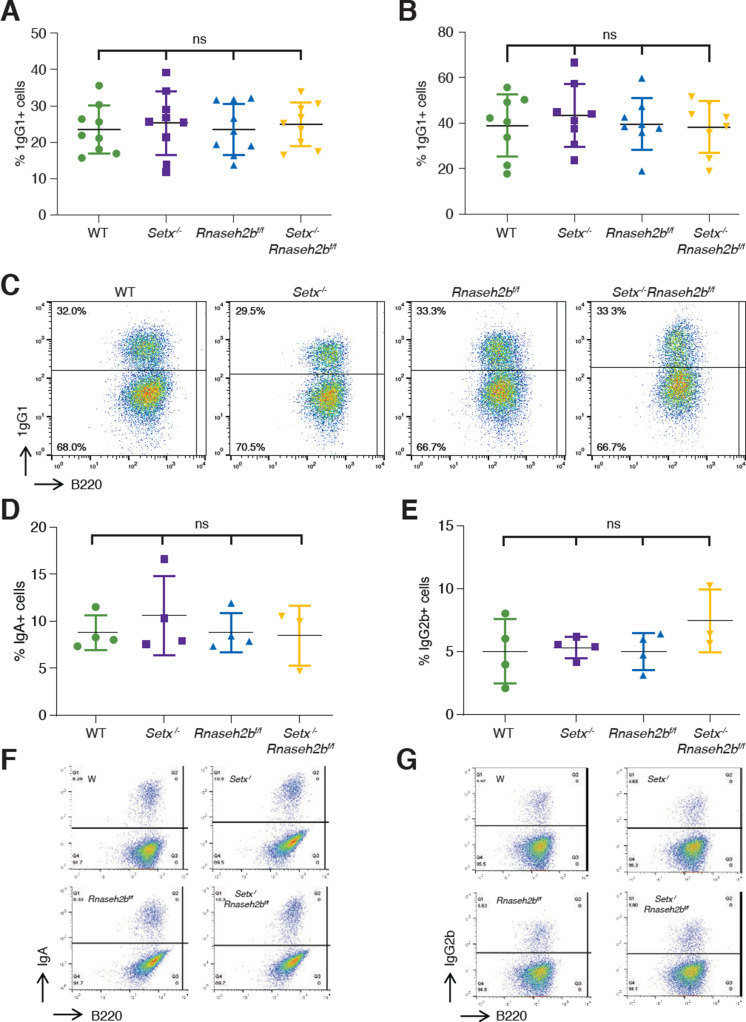
Figure 2. Class switch recombination (CSR) is not reduced in Setx-/-, Rnaseh2bf/f, or Setx-/-Rnaseh2bf/f B cells.
Percentage of cells undergoing CSR to IgG1 72 hr (A) and 96 hr (B) post-stimulation with LPS/IL-4/α-RP105. (C) Representative flow cytometry analyses of IgG1+ and B220 expression in response to LPS/IL-4/α-RP105. The percentage of IgG1+ B cells is indicated at top left. Percentage of cells undergoing CSR to IgA (D) or IgG2B (E) 72 hr post-stimulation. (F) Representative flow cytometry analyses of IgA+ and B220 expression in response to LPS/α-RP105/TGF-B/CD40L. (G) Representative flow cytometry analyses of IgG2B+ and B220 expression in response to LPS/α-RP105/TGF-B. Horizontal lines in dot plots indicate mean, and error bars show standard deviation. Statistical significance versus WT was determined by one-way ANOVA; each dot represents an independent mouse.
Figure 2—figure supplement 1. Percentage of cells undergoing class switch recombination (CSR) to IgG1 72 hr post-stimulation with LPS/IL-4 alone.


