. 2022 Dec 21;11:e78917. doi: 10.7554/eLife.78917

Figure 3. Increased IgH damage is observed in Setx-/-Rnaseh2bf/f B cells.

(A) Frequency of spontaneous DNA damage in WT, Setx-/-, Rnaseh2bf/f, and Setx-/-Rnaseh2bf/f cells. (B) Frequency of spontaneous DNA damage at IgH. (C) Representative images of the types of rearrangements produced. IgH-specific probe visualized in green, Telomere-specific probe visualized in red, DAPI is in blue. All cells were harvested 72 hr post-stimulation to IgG1 with LPS/IL-4/α-RP105. Error bars show standard deviation; statistical significance versus WT was determined by one-way ANOVA (n = 4 independent mice).

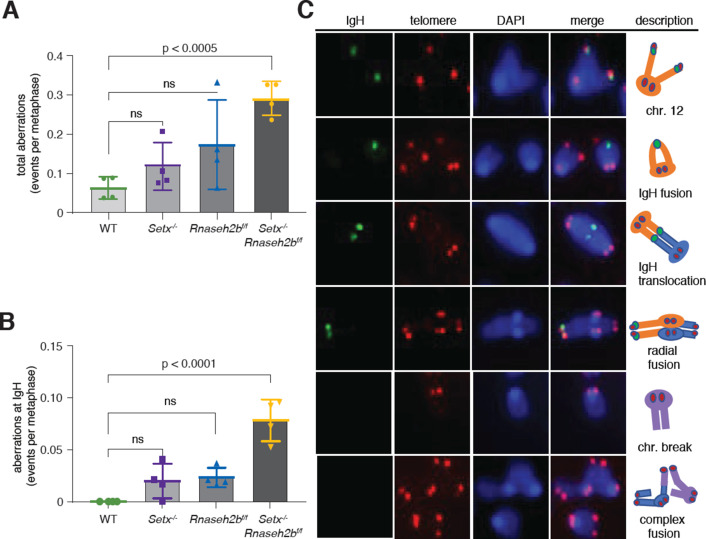
Figure 3—source data 1. Numerical data used to generate graphs in Figure 3A and B.

Figure 3.

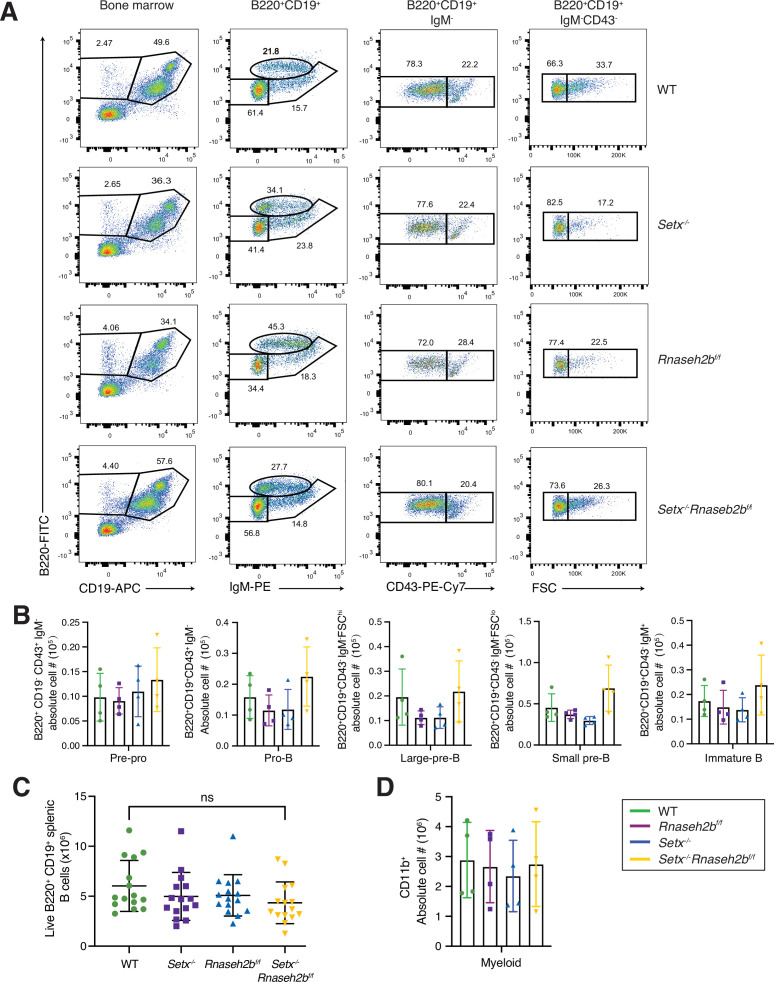
Figure 3—figure supplement 1. B cell development in the bone marrow is normal in cells lacking senataxin (Setx) and RNase H2B.

Figure 3—figure supplement 1.

(A) Flow cytometric gating of different developmental stages of B lymphopoiesis in the bone marrow (BM) of WT, Setx-/-Rnaseh2bf/f, and Setx-/-Rnaseh2bf/f mice (n = 4). Pre-pro-B cells are defined as B220+CD19- CD43+IgM-, pro-B cells are defined as B220+CD19+CD43+IgM-, large and small pre-B cells are defined as B220+ CD19+CD43−IgM−FSChi and B220+CD19+CD43−IgM−FSClo, respectively, and immature B cells are defined as B220+CD19+CD43−IgM+ FSC, forward scatter. (B) Absolute number of cells per mouse at different stages of B cell development in the BM of WT, Setx-/-, Rnaseh2bf/f, and Setx-/-Rnaseh2bf/f mice (n = 4). (C) Number of mature naïve B lymphocytes isolated from spleen. (D) Absolute number of myeloid compartment cells (CD11b + cells) in BM.
Figure 3—figure supplement 1—source data 1. Numerical data used to generate graphs in Figure 3—figure supplement 1B–D.
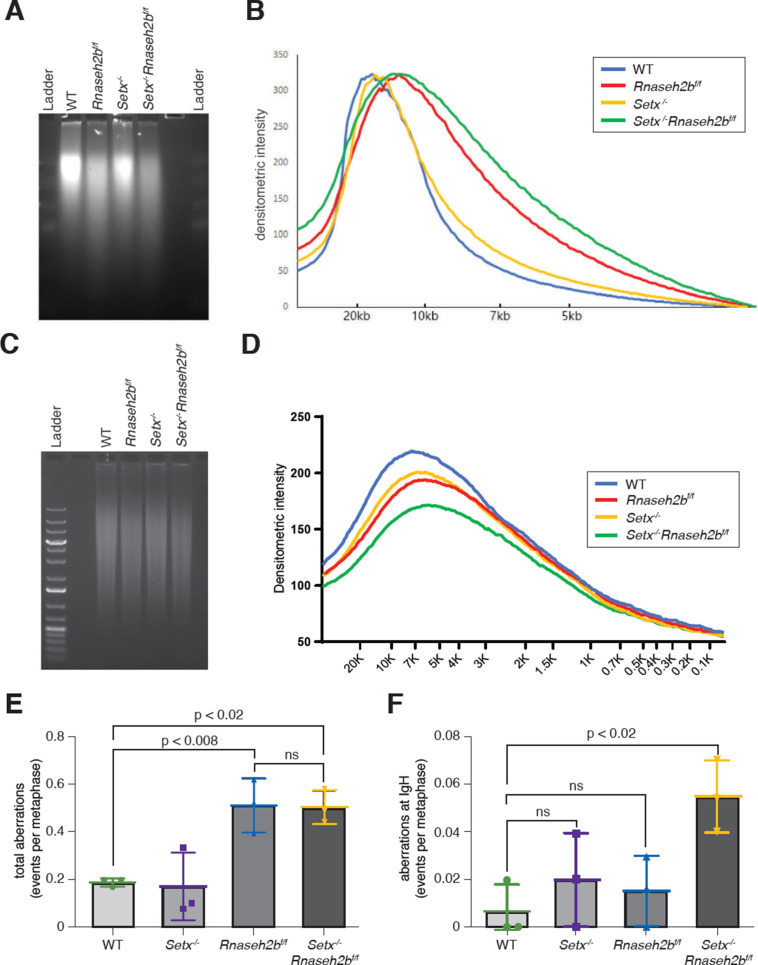
Figure 3—figure supplement 2. Ribonucleotide monophosphate (rNMP) incorporation and camptothecin (CPT) sensitivity in cells lacking senataxin (SETX) and RNase H2.

Figure 3—figure supplement 2.

(A) Representative image of alkaline gel of genomic DNA (n = 3 independent mice/genotype). (B) Densitometry trace of representative alkaline gel shown in (A) with ImageJ software. (C) Representative image of native gel of genomic DNA (n = 3). (D) Densitometry trace of representative native gel shown in (A) with ImageJ software. (E) Frequency of DNA damage in WT, Setx-/-, Rnaseh2bf/f, and Setx-/-Rnaseh2bf/f cells after exposure to 5 nM CPT for 20 hr. (F) Frequency of DNA damage at IgH in CPT-treated cells. All cells were harvested 72 hours post-stimulation to IgG1 with LPS/IL-4/α-RP105. Statistical significance versus WT was determined by one-way ANOVA (n = 3 independent mice/genotype).
Figure 3—figure supplement 2—source data 1. Uncropped alkaline gel image from WT, Rnaseh2bf/f, Setx-/-, and Setx-/-Rnaseh2bf/f cells.
Genomic DNA from WT, Rnaseh2bf/f, Setx-/-, and Setx-/-Rnaseh2bf/f B cells was treated with NaOH for 3 hr before running the alkaline gel.
Figure 3—figure supplement 2—source data 2. Uncropped native gel image of WT, Rnaseh2bf/f, Setx-/-, and Setx-/-Rnaseh2bf/f B cells.
Genomic DNA from WT, Rnaseh2bf/f, Setx-/-, and Setx-/-Rnaseh2bf/f B cells was treated with NaCl (left) or NaOH (right) for 3 hr before running the TAE native gel.
Figure 3—figure supplement 2—source data 3. Numerical data used to generate graphs in Figure 3—figure supplement 2E and F.
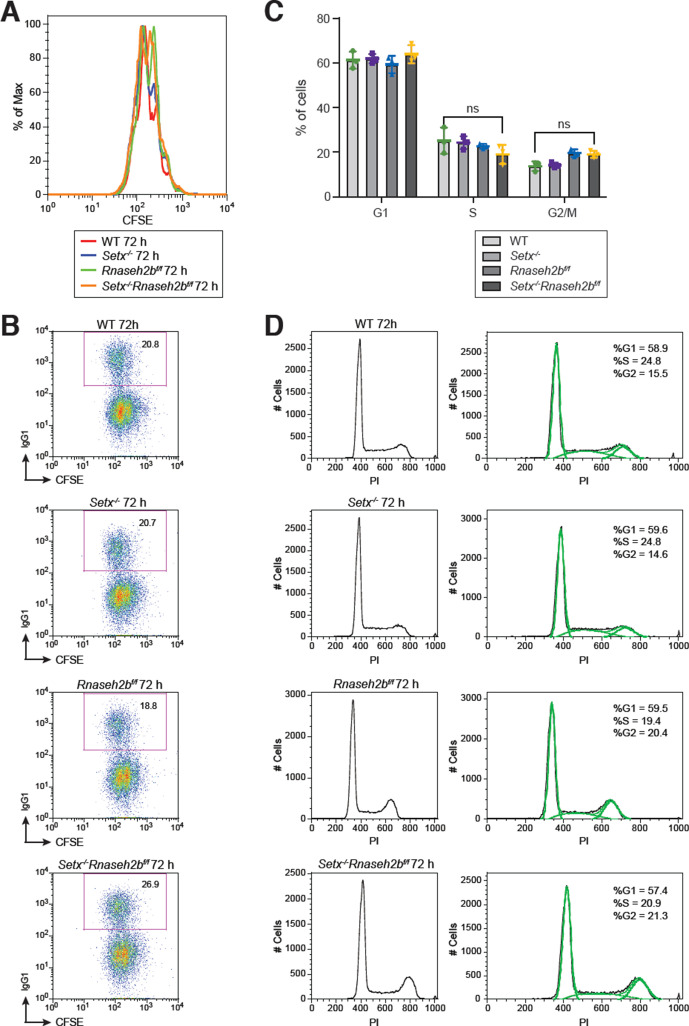
Figure 3—figure supplement 3. B cell proliferation and cell cycle in response to stimulation.

Figure 3—figure supplement 3.

(A) Flow cytometry analysis of cell proliferation with CFSE staining. CFSE-labeled primary B cells were stimulated with LPS/IL-4/α-RP105, and cell division was measured by CFSE dye dilution at 72 hr post-stimulation. (B) Representative flow cytometry analyses of IgG1 staining with CFSE staining in spleen primary B cells in response to LPS/IL-4/α-RP105. (C) The percentage of cells in each cell cycle. Error bars show the SD, and statistical analyses were performed using one-way ANOVA (n = 3 mice per genotype). (D) Representative cell cycle profiles for WT, Setx-/-, Rnaseh2bf/f, and Setx-/-Rnaseh2bf/f cells stimulated with LPS/IL-4/α-RP105.
Figure 3—figure supplement 3—source data 1. Numerical data used to generate graph in Figure 3—figure supplement 3C.