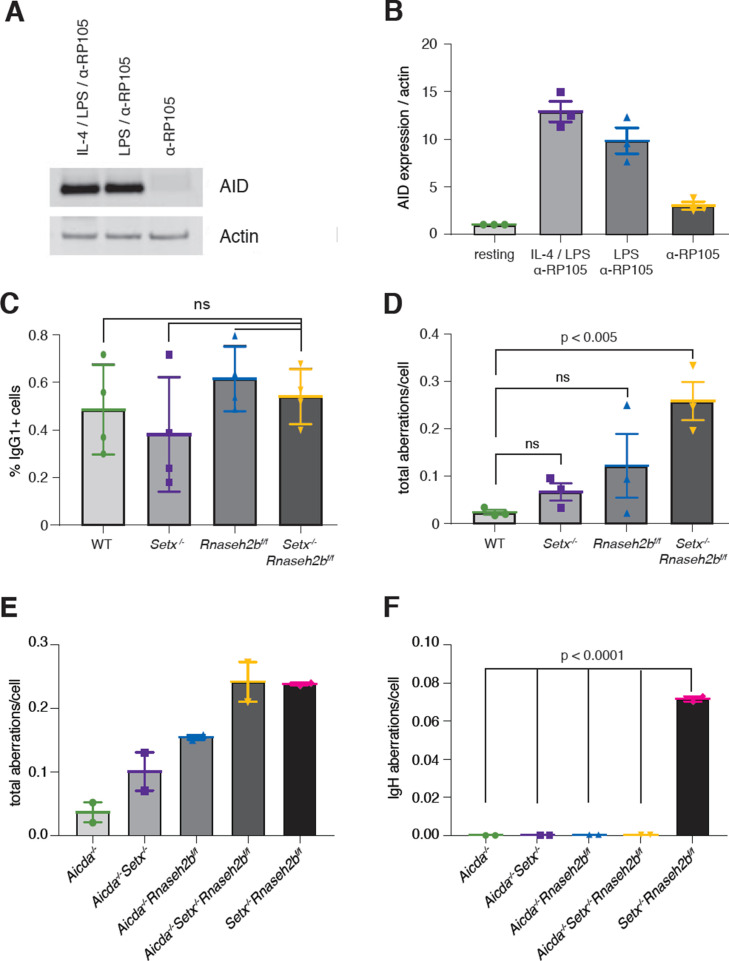
Figure 5. Activation-induced cytidine deaminase (AID) activity is required for persistent IgH breaks in Setx-/-Rnaseh2bf/f B cells.
(A) AID protein levels in WT B cells 72 hr post-stimulation to indicated isotypes (IgG1, LPS/IL-4/α-RP105; IgG3 with LPS/α-RP105; and α-RP105 alone). Actin served as a loading control. (B) Quantification of AID protein expression relative to Actin for three independent experiments, with AID expression in resting cells set as 1. Error bars show standard deviation. (C) Percent of cells undergoing class switch recombination (CSR) to IgG1 in B cells in response to α-RP105 stimulation. Error bars show standard deviation; statistical significance between each genotype was determined by one-way ANOVA (n = 3 mice/genotype). (D) Frequency of total spontaneous DNA damage under anti-RP105 treatment in vitro. Error bars show the standard deviation; statistical significance versus WT was determined by one-way ANOVA (n = 3 mice/genotype). (E) Frequency of total spontaneous DNA damage 72 hr post-stimulation with LPS/IL-4/α-RP105 in Aicda-/-, Aicda-/-Setx-/-, Aicda-/-Rnaseh2bf/f, Aicda-/-Setx-/-Rnaseh2bf/f, and Setx-/-Rnaseh2bf/f cells (n = 2 independent mice/genotype). (F) Frequency of spontaneous IgH damage in Aicda-/-, Aicda-/-Setx-/-, Aicda-/-Rnaseh2bf/f, Aicda-/-Setx-/-Rnaseh2bf/f, and Setx-/-Rnaseh2bf/f cells 72 hr after stimulation with LPS/IL-4/α-RP105. Error bars show the standard deviation; statistical significance versus WT was determined by one-way ANOVA.


