Figure 9.
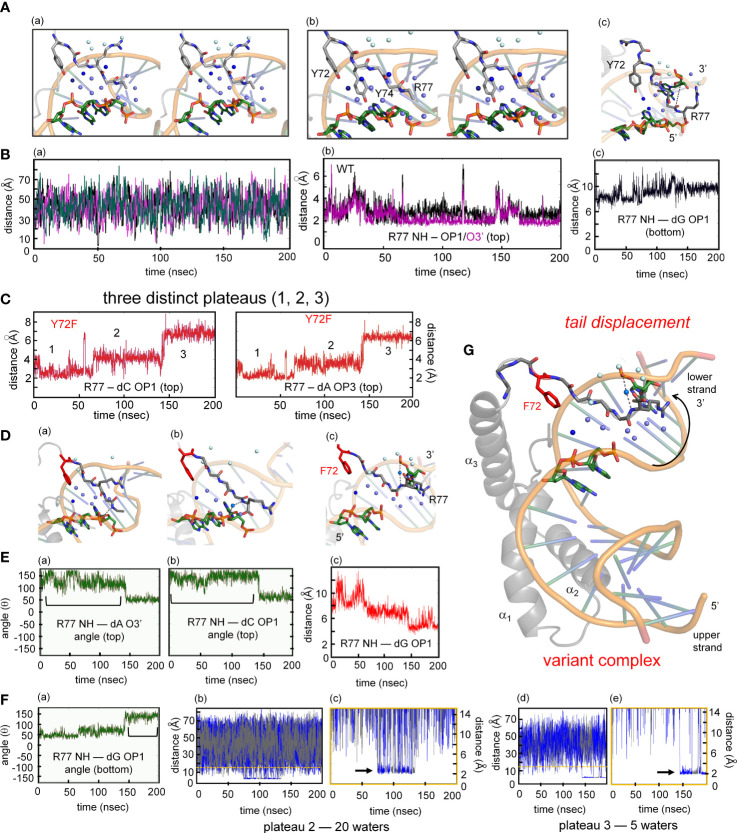
MD simulations of protein-DNA interfaces. (A) (a) Stereoview of the water network of WT SOX18-DNA complex during single water-mediated hydrogen-bond motif with the longest occupancy time in dark blue. The Tyr72-DNA bridging water is in dark blue, other interfacial waters in light blue and the bulk water in pale cyan. (b) Stereoview of the tail highlighting the Y72 and the side chain of Y74. The tyrosine at position forms a hydrogen bond with the nucleobase. (c) Structural view of the two water-mediated hydrogen-bond motif and associated interfacial waters at the end of the molecular dynamic simulation. The broken line represents the distance between Arg77 amide to an oxygen atom of a cytosine phosphate on the lower strand (chain C C7 in Sox18 box-DNA crystal structure). (B) (a) The course of five water molecule close to Arg77 amide at different time points during the MD simulation. Each of the water molecules show Brownian motion with very short occupancy times. (b) Trajectory of the WT Arg77 amide to oxygen atoms on a cytosine phosphate represented in purple and black. (c) Trajectory of WT Sox18 Arg77 amide to guanosine (chain B G14) of DNA. (C) Course of Arg77 amide and OP1 and O3’ with stepwise three distinct distance profile. (D) (a-c) Representative structural views of the variant-DNA complex from each of the distinct three distance phase of Arg77 amide and DNA. Long-lived water is observed (dark blue) and associate interfacial waters are in depicted in light blue and bulk water in pale cyan in step 1 (a), step 2 (b) and step 3 (c). The broken line represents a direct hydrogen bond between the amide of Arg77 and an oxygen of the DNA backbone. In panel (b) a water mediates the interaction between the amide of R77 and C7 (chain C), in (c) the water-mediated hydrogen bond between the amide of R77 has switched to G14 (Chain B). Panels a-c is representation of the diffusion process of bulk water at the interface in variant. (E) (a-b) Hydrogen-bond angle between Arg77 amide-O3’(a) and OP1(b) over the course of MD simulation for variant complex. Bracketed regions represent appropriate angles for hydrogen bond formation. (c) Trajectory of the amide of Arg77 to OP1 of a bottom strand guanosine indicating the shift of the tail from the top strand towards the bottom strand. (F) (a) Angle profile for amide Arg77 and OP1 of the guanosine with bracket indicates an appropriate angle for hydrogen bond. (b-e) Trajectories of the different water molecules that mediate hydrogen bond between amide of Arg77 to the DNA at plateau 2 (b) and plateau 3 (d) with expansion of respective plateau 2 (c) and 3 (e). Black arrow in each expanded panel highlights bridging water between R77 and the DNA, alternating blue and gray colors represent a different water that participates in bridging interaction. (G) Structure of the variant Sox18-DNA complex at the end of the MD time scale. The extended water network is shown with the same blue hue scheme. Positioning of the tail, especially the tail residue R77 has switched to the opposite strand (lower) indicated by a curved arrow. The water-mediated hydrogen bonding of R77 to the upper strand is shown as dashed lines.

