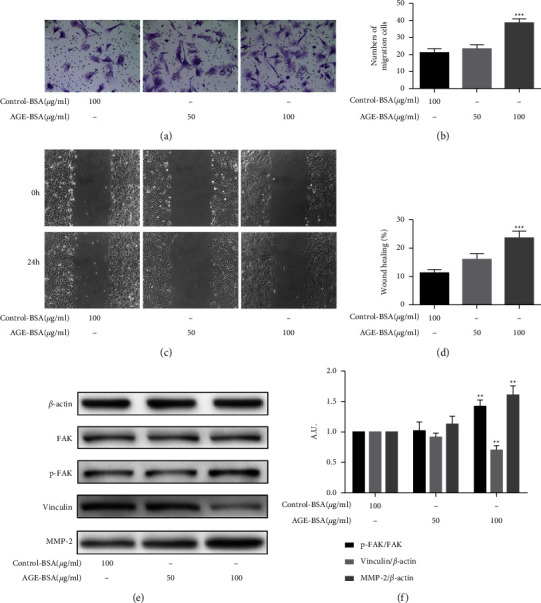
Figure 4.

AGE-BSA induced retinal pericytes migration. (a, b) Transwell assays show the migration of retinal pericytes with different concentrations of AGE-BSA (50 and 100 μg/ml) and control-BSA (100 μg/ml). The cells were counted under 20x objective lens. (c, d) Wound-healing assays show the migration of retinal pericytes (10x objective lens). (e, f) The expressions of FAK, p-FAK, vinculin, and MMP-2 were measured via the western blot analysis. ∗∗∗p < 0.001 vs control group and ∗∗p < 0.01 vs control group; p values were calculated using Turkey's t-test; A. U., arbitrary units.
