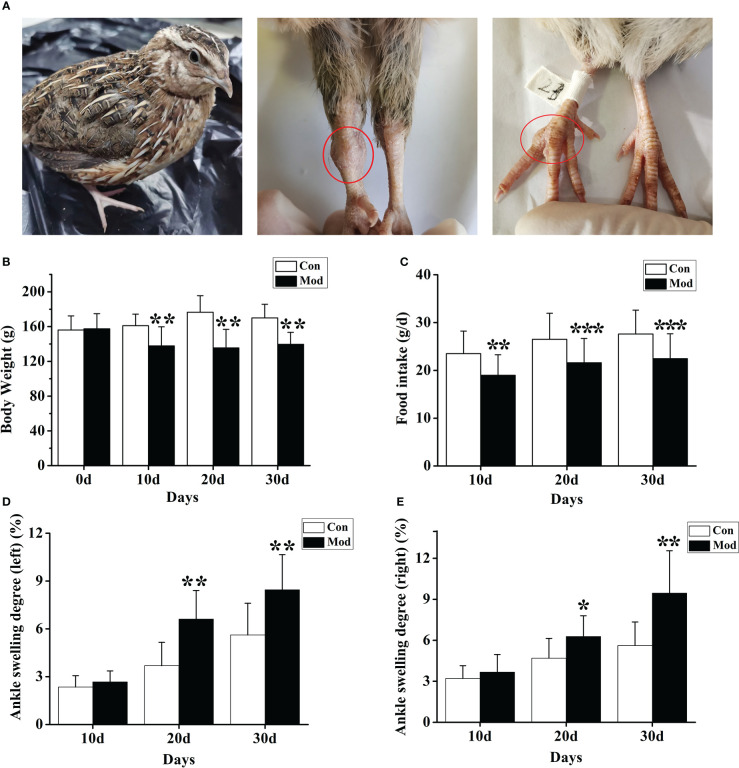
Figure 1.
The general state of quail in the modeling process. (A) Swelling degree of quail joints in Mod group. (B) The body weight of quails in each group at different experimental stages. (C) The food intake of quail in each group at different experimental stages. The left (D) and right (E) of the swelling degree of the quail ankle joint during the experiment. Data are expressed as mean ± SEM for 8 quails in each group. *P < 0.05, **P < 0.01 and ***P < 0.001 versus Con group.

