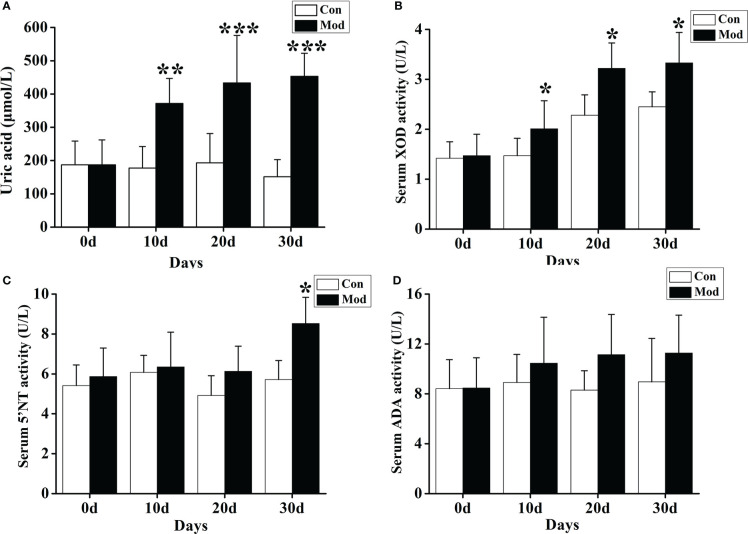
Figure 3.
Increased uric acid level and expression of related uric acid production and metabolism enzymes. (A) The serum uric acid level. (B) The XOD activity in the serum. (C) The 5’-NT activity in the serum. (D) The ADA activity in the serum. Data are expressed as mean ± SEM for 8 quails in each group. *P < 0.05, **P < 0.01 and ***P < 0.001 versus Con group.

