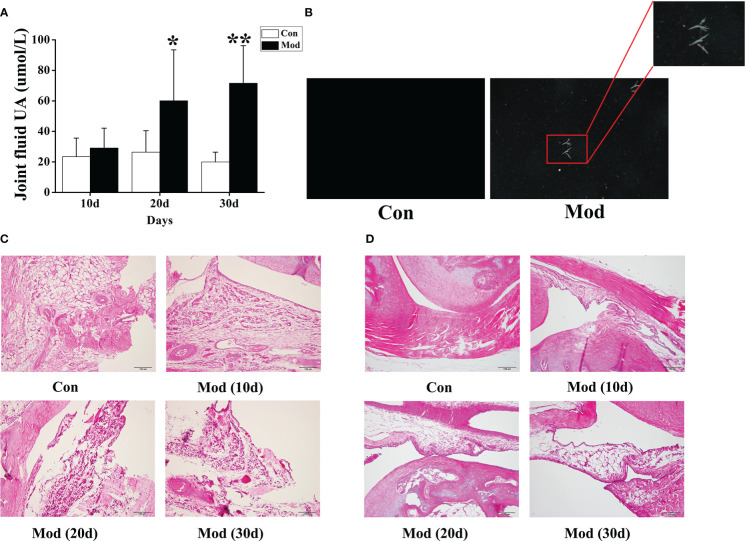
Figure 5.
The levels of uric acid in joint fluid and HE staining of joints of quails in different experimental stages. (A) The joint fluid uric acid level of the quails. (B) The urate crystals appeared in the synovial fluid of quails. (C) HE staining of ankle joint (200×). (D) HE staining of claw joint (200×). Data are expressed as mean ± SEM for 8 quails in each group. *P < 0.05 and **P < 0.01 versus Con group.

