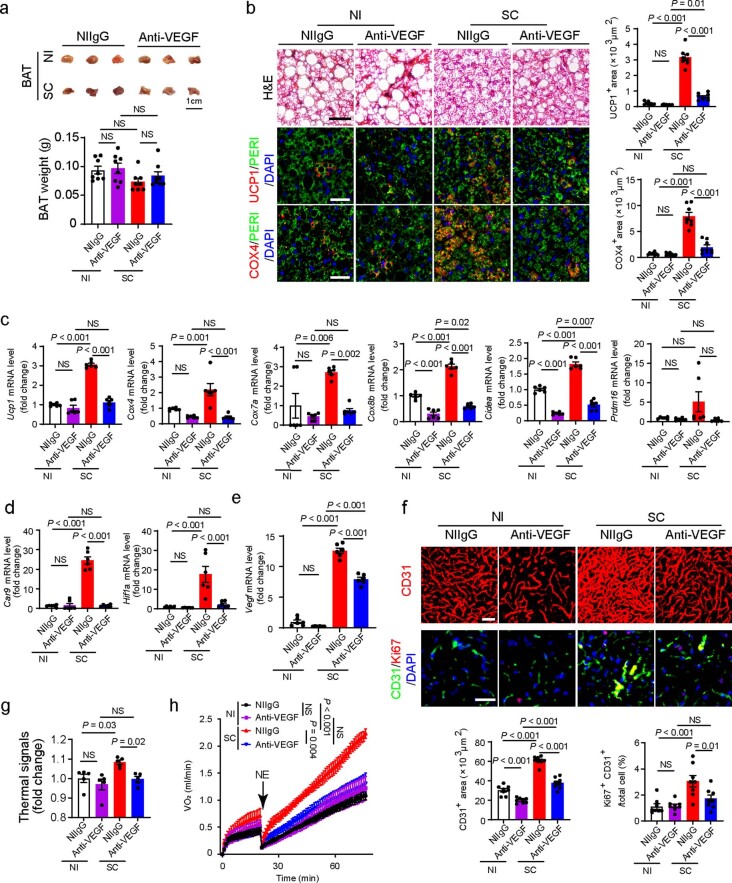
Extended Data Fig. 4. BAT whitening and ablation of NST by blocking VEGF.
(a) Representative pictures of BAT and quantification of BAT weights of non-immune IgG (NIIgG)- and anti-VEGF-treated NI- or day-6-post SC-infected mice (n = 8 samples per group). (b) Histological and immunohistochemical analyses of BAT of NIIgG- and anti-VEGF-treated NI- or day-6-post SC-infected mice by staining with H&E, Perilipin (PERI), UCP1 and COX4. Tissue sections were counter stained with DAPI (blue). Quantifications of UCP1 and COX4 positive signals in BAT (n = 8 random fields per group). (c) mRNA levels of browning markers of Ucp1, Cox4, Cox7a, Cox8b, Cidea, and Prdm16 in BAT of NIIgG- and anti-VEGF-treated NI- or day-6-post SC-infected mice were quantified by qPCR (n = 6 samples per group). (d) qPCR quantification of Car9 and Hif1a mRNA levels in BAT of NIIgG- and anti-VEGF-treated NI- or day-6-post SC-infected mice (n = 6 samples per group). (e) qPCR quantification of Vegf mRNA levels in BAT of NIIgG- and anti-VEGF-treated NI- or day-6-post SC-infected mice (n = 6 samples per group). (f) CD31 and Ki67 staining and quantification of microvessels in BAT of NIIgG- and anti-VEGF-treated NI- or day-6-post SC-infected mice. Tissue sections were counterstained with DAPI (blue). CD31 and Ki67 double positive signals of BAT were quantified (n = 8 random fields per group). (g) Quantification of interscapular thermal signals of NIIgG- and anti-VEGF-treated NI- or day-3-post SC-infected mice (n = 5 mice per group). (h) Measurements of NST by norepinephrine in NIIgG- and anti-VEGF-treated NI- or day-3-post SC-infected mice. NE = norepinephrine (n = 5 mice per group). Data are presented as means ± s.e.m. Statistical analysis was performed using one-way analysis of variance (ANOVA) followed by Tukey multiple-comparison test. NS = not significant. NI = non-infected. SC = SARS-CoV-2. Scale bar = 50 μm.

