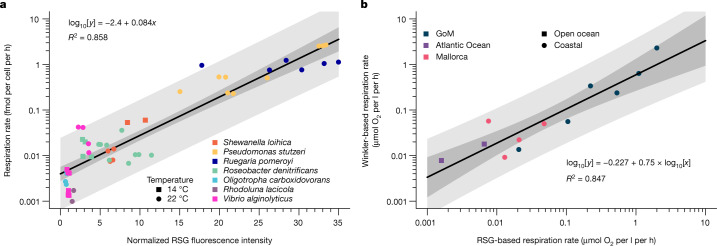
Fig. 1. Calibration and validation of RSG-based prokaryoplankton respiration measurements.
a, Comparison of normalized RSG fluorescence intensity with cell-specific O2 consumption rates in laboratory cultures. Each point represents one culture experiment (n = 50), with the fluorescence values normalized to fluorescence bead standards used to intercalibrate the instrument. Additional experimental details are provided in Supplementary Table 1. b, Comparison of bulk marine prokaryoplankton respiration rates determined using Winkler and cell-specific RSG methods (n = 12). For the RSG method, the per-cell average respiration rate was calculated from per-cell respiration rates and then used to calculate the total amount of O2 consumed together with the number of RSG labelled cells per ml. In both plots, the darker-shaded area represents the 95% confidence interval, and the lighter-shaded area is the 95% predicted interval, around the regression line.

