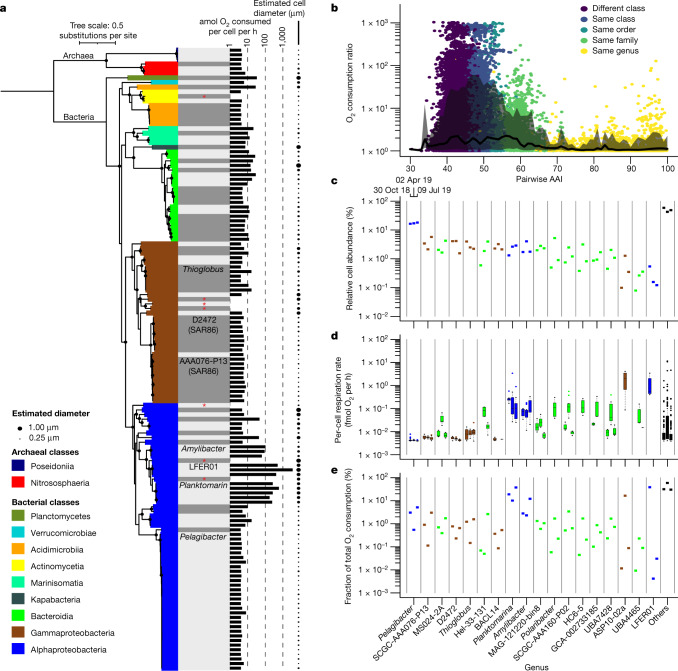
Fig. 2. Cell-specific respiration rates of GoM prokaryoplankton.
a, The phylogenetic composition, respiration rates and diameters of individual prokaryoplankton cells collected in October 2018. Maximum-likelihood tree of the 16S rRNA gene that was rooted in Archaea is shown. Bootstrap values of greater than 0.75 are indicated by black circles. Genera are separated by grey and white shading. The names of genera discussed in this Article are shown. Reference entries of cultured isolates are indicated by a red asterisk. b, The relationship between amino acid identity and the ratio of O2 consumption in pairs of cells recovered from the same sample. The black line indicates the median O2 consumption ratio at 1% intervals and the grey-shaded area is bounded by the 10% quantile below and the 90% quantile above. c, Genus-specific cell abundance on the basis of metagenomic read recruitment. d, Genus-specific per-cell respiration rates. The box and whisker plots indicate the median (centre line), first and third quartiles (box limits), and 1.5 × interquartile range (whiskers). The dots indicate outliers outside 1.5 × interquartile range. e, The fraction of prokaryoplankton respiration performed by each genus. Included in c–e are the ten most abundant genera and ten genera with the greatest contribution to community respiration. The vertical grey lines separate genera. The colours in c–e are as defined in a. Note that the genus-specific respiration estimates take into account cells that fall below the RSG detection limit, as described in the Methods. For c–e, the sampling date is indicated in the top left of c and the number of sorted and sequenced cells per day was n = 282 (30 October 2018), n = 274 (2 April 2019) and n = 277 (9 July 2019).

