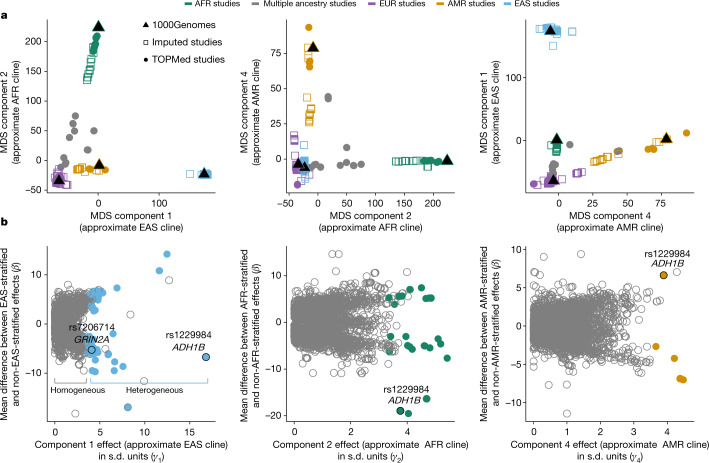
Fig. 1. Ancestry composition and effect size moderation.
a, Ancestry compositions of contributing studies (each point is a study). Colours are coded by primary ancestry of individuals in the cohort. Studies with less than 90% of individuals assignable to a single ancestry group are shown in grey. Ancestry component 3 was a north–south EUR cline, which was omitted here as we did not conduct meta-analyses stratified by northern versus southern Europe. TOPMed, Trans-Omics for Precision Medicine. b, Extent of effect size moderation as a function of the same ancestry dimensions as shown in a. The full moderation results are in Supplementary Table 2. Each point in b represents an independent variant with the standardized MDS component coefficient from our trans-ancestry models (that is, γ) along the x axes, and the corresponding mean difference in effect sizes (β) for the ancestry-stratified meta-analysis of the given ancestry versus all other ancestries along the y axes. The grey circles indicate variants showing little to no evidence of effect size heterogeneity across ancestry, whereas the coloured circles represent variants with adequate evidence of effect size heterogeneity. The plots highlight that the majority of variants have similar effect sizes across all ancestry clines, with some potentially interesting exceptions in which the variant effects sizes differ substantially between ancestry clines.

