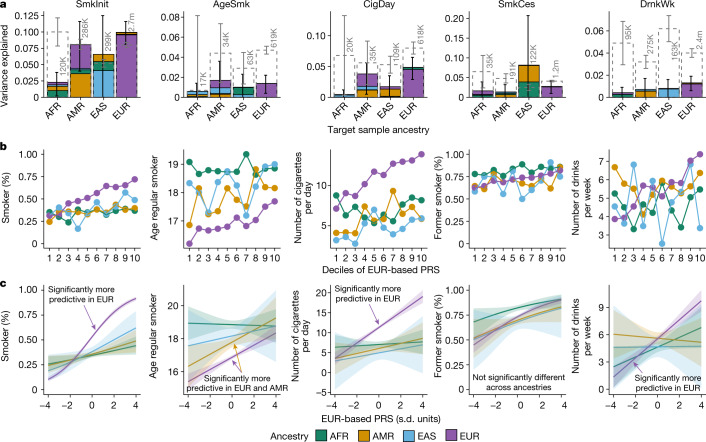
Fig. 2. Within-ancestry and across-ancestry performance of polygenic scores in an independent target sample (Add Health35).
a, Incremental variance explained for each target ancestry group. The colour of the stacked bars indicates the ancestry from which the polygenic score was derived; the total height of each set of the stacked bars (and 95% confidence intervals) correspond to the total variance explained by all four ancestry-stratified scores combined. For example, in the target EUR subsample, non-EUR polygenic scores add little over and above the EUR score. Note that some comparisons are underpowered to detect differences in predictive accuracy across ancestry (see Supplementary Note). Heritabilities, estimated by LD score regression, of each phenotype–ancestry combination are depicted by the grey dashed bar (with 95% confidence intervals) and corresponding sample sizes; these represent the maximum expected accuracy of the polygenic risk score (PRS). b, The manner in which the phenotype mean in the target sample changes as a function of the EUR PRS deciles. c, Results from an interaction model, in which each phenotype was modelled as a function of an interaction between the EUR-based PRS and target ancestry (coded as a factor with EUR ancestry as the reference and scores scaled within ancestry). The bands around each line denote the 95% confidence intervals. Significant interactions are noted with text. Using SmkInit as an example, the purple line represents the predicted proportion of regular smokers as a function of the EUR PRS in the EUR subsample of Add Health, the blue lines show the predicted proportion of regular smokers by standard deviation of the EUR PRS in the EAS subsample, and so on. In this case, the magnitude of the association between the EUR-based PRS and SmkInit (that is, the slope) was significantly greater in the EUR target ancestry than all other ancestries. Full PRS results are in Supplementary Table 12.

