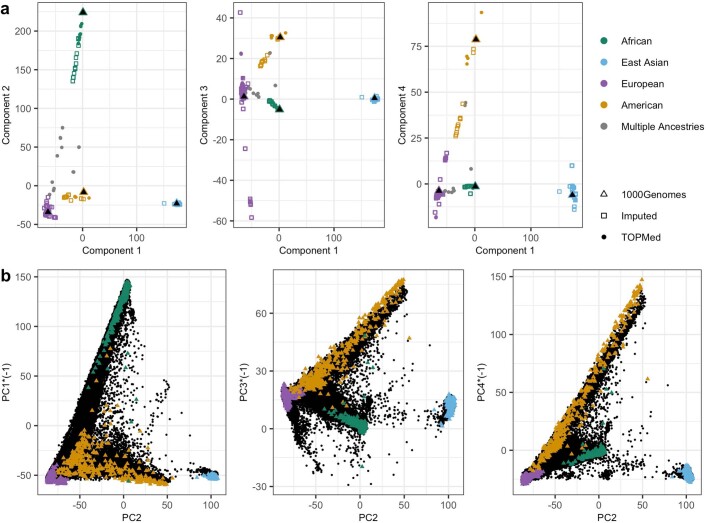
Extended Data Fig. 1. Ancestry space of studies contributing to meta-analysis (panel a), versus individuals from TOPMed and 1000 Genomes (panel b).
The meta-regression within the MEMO model requires specification of ancestry clines. To ensure consistency in the meaning of ancestry clines across all five MEMO analyses (one for each phenotype) we created a single multidimensional scaling solution based on allele frequencies from all phenotypes in all participating cohorts. These solutions are plotted in panel a (circles correspond to TOPMed cohorts, squares are all other cohorts which used imputed microarray genotypes, and triangles are 1000 Genomes ancestry groups). Colors of points correspond to the primary assigned ancestry of each cohort (studies with < 90% of individuals coming from a single ancestry group are shown in grey). Panel b shows projection of principal components (after OADP transformation) of TOPMed individuals onto PCs of 1000 Genomes individuals, in colored triangles. Each 1000 Genomes individual is colored by their known ancestry. This PC information was used in assigning ancestry to TOPMed individuals for the purpose of reference panel creation (individuals of South Asian ancestry were not included in analyses). The PCs in panel b were reordered or reversed in some cases to align with panel a. These transformations are noted in the axis labels.

