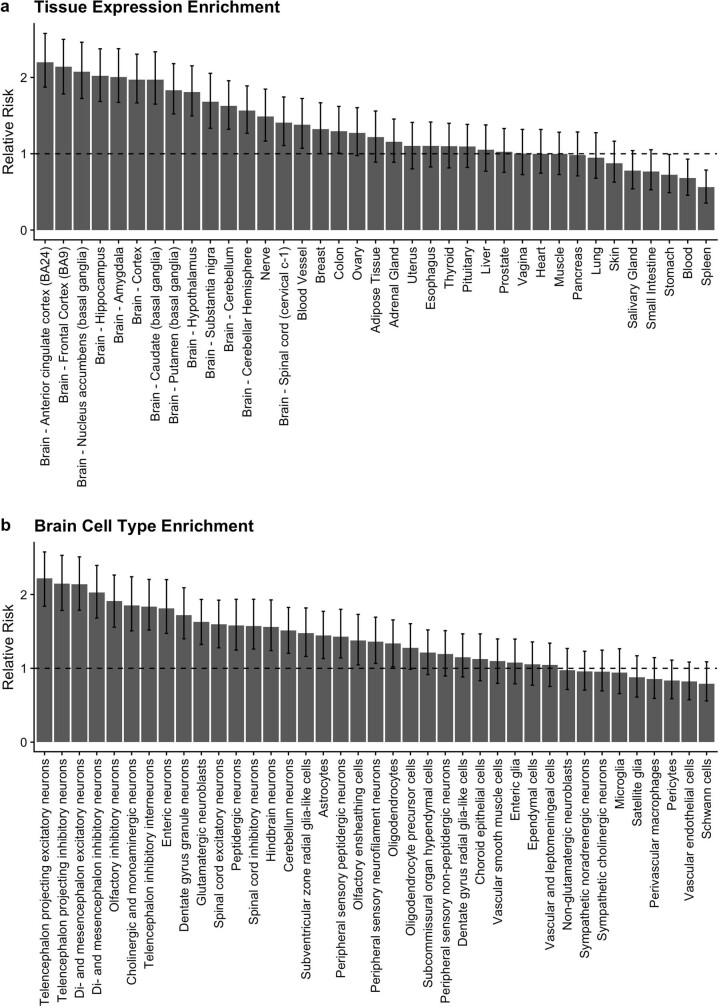
Extended Data Fig. 3. Tissue expression and brain cell type enrichment in high priority genes.
Panel a shows tissue expression enrichment in ‘high priority’ genes. We define high priority genes here as those located nearest to the variants in fine-mapped credible intervals containing less than five variants. These genes were compared to ‘control’ genes identified in the same way, but from variants in credible intervals with PIP < 0.01 from the trans-ancestry fine-mapping. The x-axis denotes GTEx tissue types. The y-axis represents relative risk estimates comparing high priority to control genes. Panel b shows similar relative risk comparisons with 39 brain cell types. Data are presented as relative risk values with error bars denoting bootstrapped 95% confidence intervals. Further details on estimating relative risk are included in the Supplementary Note section ‘Functional enrichment’.

