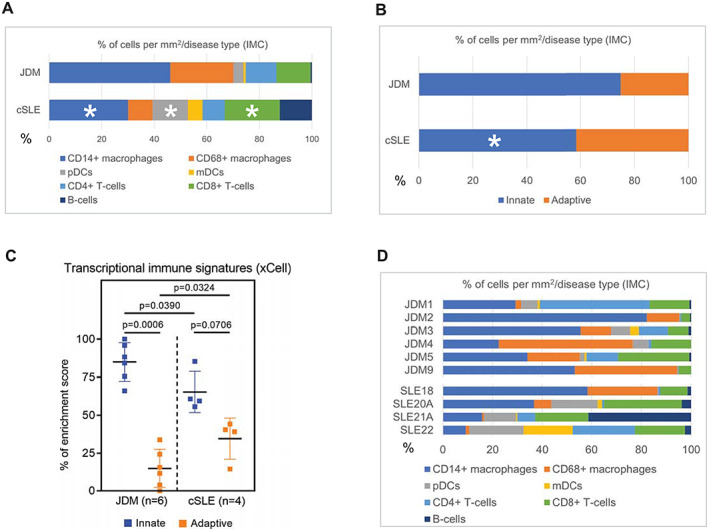
Figure 2.

Overall immune cell composition in JDM compared to cSLE skin was predominantly innate immune cells. A and B, Bar graphs showing percent composition of immune cell types by disease (A) and innate versus adaptive immune cell categorization, with CD14+ and CD68+ macrophages, pDCs, and mDCs categorized as innate, and CD4+ and CD8+ T cells and B cells as adaptive (B). * = P < 0.05 versus JDM. C, Innate versus adaptive immune cell enrichment from skin microarrays of the same patients. Bars show the mean ± SD. D, Bar graph showing individual patient sample immune cell composition. IMC = imaging mass cytometry (see Figure 1 for other definitions).
