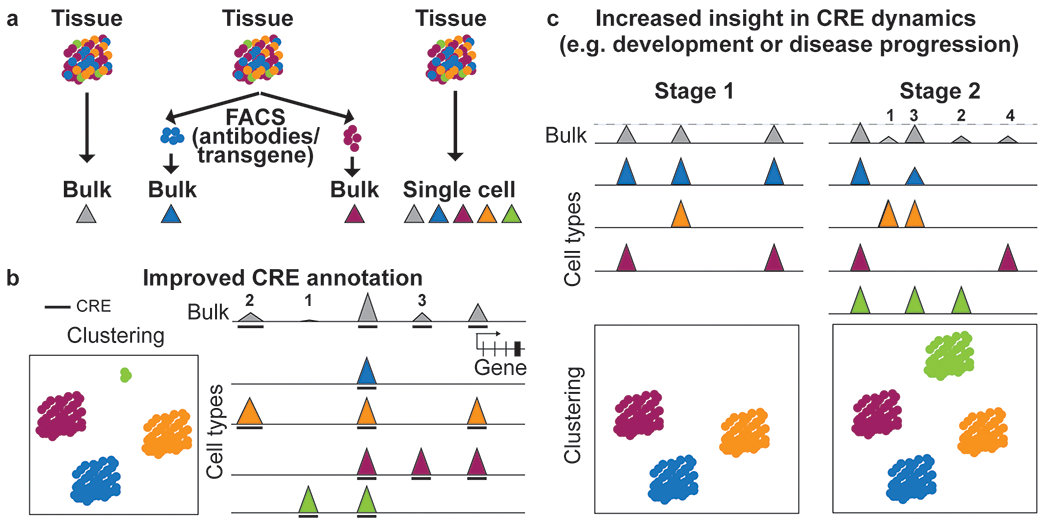
Figure 2: Single-cell epigenomic profiling enables insight into cell-type-specific CRE annotation and activity.

a Schematic of different ways to profile epigenomes from tissue samples. Traditionally, bulk assays are used that result in one average dataset for the tissue (left). Cell types with established surface or intracellular markers that can be identified using antibodies, transgenic expression or lineage tracers can be sorted prior to epigenomic profiling to enable insight into distinct cell types. Cell types without known epitope or validated antibody and unknown cell types could be missed or under-represented in this approach (middle). Single-cell profiling captures known and unknown cell types. By combining reads from individual cells, it also provides a pseudobulk dataset for each cell type (right). b Single-cell epigenomic datasets can be used to group cells with similar profiles into clusters corresponding to cell types or cell states and to infer tissue composition (left). Single-cell epigenomic profiles can be used to deconvolute activities of CREs (1-4 and 6) in each cell type making up the heterogeneous sample and enable annotation of an additional CRE (5) only active in the rare cell type (green) that was not detected in the bulk dataset. Lower signal strength in bulk as compared to the maximum signal (CRE 1) can be due to full activity in only one cell type (CRE 2,4,6) or lower activity of the CRE in several cell types (CRE 3). Activity of distal and proximal CREs can also be used to predict putative enhancer-promoter pairs (CRE 2 and 6). Height of peaks indicates signal strength. Arc indicates linkage between enhancer and promoter. The bold line beneath the tracks indicates peak calls. c Cell type resolution is critical to studying dynamic activities of CREs in development and disease. Clustering analysis shows that a tissue at Stage B contains an additional cell type compared to Stage A and two of the cell types transitioned to a new state (indicated by arrows) (top). Multiple different scenarios could explain the changes seen in the bulk profile. An increase in signal between stages can result from an increase in the activity of a single CRE (Scenario 1); from activation of a CRE in a cell type already present in Stage B (Scenario 2); from activity of a CRE in the Stage B-specific cell type (Scenario 3); or a combination of these mechanisms (Scenario 4). A CRE with lower signal strength in bulk data can be caused by changes solely in the cellular composition, for example if a CRE is not active in the stage B specific cell type which leads to a lower fraction of cell types in which the CRE is active (Scenario 5, see ‘cluster proportion’ graph on the top right). A CRE with unaltered signal strength can result from changes in multiple cell types that compensate each other (Scenario 6). Height of peaks indicates signal strength.
