

Abstract
Cell lines are the most used model system in cancer research. The transcriptomic data of established prostate cancer (PCa) cell lines help researchers explore differential gene expressions across the various PCa cell lines. Through large scale datamining, we established a curated Combined Transcriptome dataset of PCa Cell lines (CTPC) which contains the transcriptomic data of 1840 samples of 9 commonly used PCa cell lines including LNCaP, LNCaP-95, LNCaP-abl, C4-2, VCaP, 22Rv1, PC3, DU145, and NCI-H660. The CTPC dataset provides an opportunity for researchers to not only compare gene expression across different PCa cell lines but also retrieve the experiment information and associate the differential gene expression data with meta data, such as gene manipulation and drug treatment information. Additionally, based on the CTPC dataset, we built a platform for users to visualize the data (https://pcatools.shinyapps.io/CTPC_V2/). It is our hope that the combined CTPC dataset and the user-friendly platform are of great service to the PCa research community.
Background
Prostate cancer (PCa) is one of the most common cancers in American men and the second leading cause of cancer-related deaths. Cell line models are commonly used in PCa research. They are cost efficient and relatively easy to maintain and genetically manipulate. The transcriptomic data of PCa cell lines can provide invaluable molecular information for researchers to choose suitable cell lines for their research projects or develop testable hypotheses, as different cell lines can reflect the disease at different stages.1 Two pan-cancer studies, Cancer Cell Line Encyclopedia (CCLE) and NCI-602,3, have generated transcriptomic data for many cancer cell lines including several PCa cell lines. However, both datasets lack replicates, which weakens the data’s reliability. The Gene Expression Omnibus (GEO) database has collected a large amount of transcriptomic data derived from PCa cell lines, but these data were generated by different research groups, following different experimental protocols and using different sequencing platforms. Basic bioinformatic skills are needed to retrieve gene expression data from these studies, and more advanced skills are needed to compare data across different studies. We established a curated Combined Transcriptome dataset of PCa Cell lines (CTPC) which contains 1840 samples covering seven commonly used PCa cell lines (LNCaP and its derivative C4-2, VCaP, 22RV1, PC3, DU145 and NCI-H660). These cells were cultured under various conditions or had undergone various genetic alterations. Additionally, we developed a user-friendly platform to visualize the normalized gene expression data as well as the annotated meta data of the samples collected in CTPC (https://pcatools.shinyapps.io/CTPC_V2/). This allows scientists to examine the expression levels of their genes of interest across different PCa cell lines and correlate gene expression levels with treatment conditions.
Methods
The datamining was performed using R/ Rstudio4,5 with customized codes. The raw sequencing data were extracted from ARCHS4, which stores a collection of gene expression count matrix adapted from GEO6, using key words “VCaP”, “LNCaP”, “C42”, “22RV1”, “PC3” and “DU145”. All publicly available transcriptomic data of NCI-H660, the only available neuroendocrine prostate cancer cell line, were added manually to our database because few studies have been conducted using this cell line. We were able to extract a total of 14 H660 samples from 6 studies directly from the GEO database. The RNA-seq data generated by CCLE and Dr. Korkola’s group were also included because both contain H660 samples2,7.
Among all 1840 samples, 15 samples from 3 studies were in the “FPKM” format and the rest were in the “Count” format. The “Count” data were first converted into FPKM format using the “fpkm” function in “DEseq2” package. The mRNA size vectors were retrieved from the ENSEMBL database8 and the 1840 “FPKM” samples were merged, log2 transformed and normalized. The meta data, including “cell line”, “treatment” and “resource,” were manually extracted from either the original publications or GEO website based on the samples’ “GEO sample number” and “GEO series number”. The mislabelled samples, falsely selected samples, and those that were sequenced by methods other than the commonly used bulk RNA-seq (for example GRO-seq) were removed from the dataset. The normalized FPKM expression data and meta data were combined into a single dataset which is designated as the “CTPC dataset”.
To assist researchers in visualizing the gene expression data without R coding, we built a user-friendly online platform using the “Shiny” package9 (https://pcatools.shinyapps.io/CTPC_V2/). The “ggplot” and “plotly” packages were used to generate the interactive violin plots10,11.
Results
A total of 175 GEO studies were included in the CTPC dataset. Seven PCa cell lines with 344 different treatments were used in these studies. The sample numbers for each cell line are 181 for 22RV1, 147 for C4-2, 83 for DU145, 760 for LNCaP, 279 for PC3, 228 for VCaP, 16 for H660, 130 for LNCaP-95 and 16 for LNCaP-abl. “WT” represents the non-treated cells and “Control” represents the control samples, including vehicle, scramble and nontargeting RNA controls. Both meta data and the GEO accession numbers can be easily retrieved by clicking the data points on the interactive plots. This provides an opportunity for researchers to obtain more information on their study of interest.
For technical validation, we generated boxplots using the log2 FPKM values. The samples were presented individually (Figure 1A) or grouped by experimental batches (Figure 1B) or cell lines (Figure 1C). As shown in these figures, both the distribution (1st quarter to 3nd quarter) and median values appear similar across all the samples in CTPC, indicating a good normalization of the transcriptomic data. Also, we conducted dimensional reduction on the CTPC dataset. The result was visualized using PCA (principal component analysis). As shown in Figure 1D, samples of the same PCa cell line tend to co-locate and samples of different cell lines are clearly separated except LNCaP, C4-2, LNCaP-abl and LNCaP-95 samples that cluster together. This is not surprising since these cell line are LNCaP-derivatives12. Additionally, we highlighted the expression of two genes (MYCN and CPT1A) on the boxplots. As shown in Figure 1E, the LNCaP and 22RV1 samples that ectopically express MYCN exhibit high levels of MYCN mRNA. Similarly, the C4-2/CPT1A overexpression samples displayed high levels of CPT1A mRNA while the C4-2/CPT1A knock-down samples (shCPT1A) displayed low expression (Figure 1F).
Figure 1,
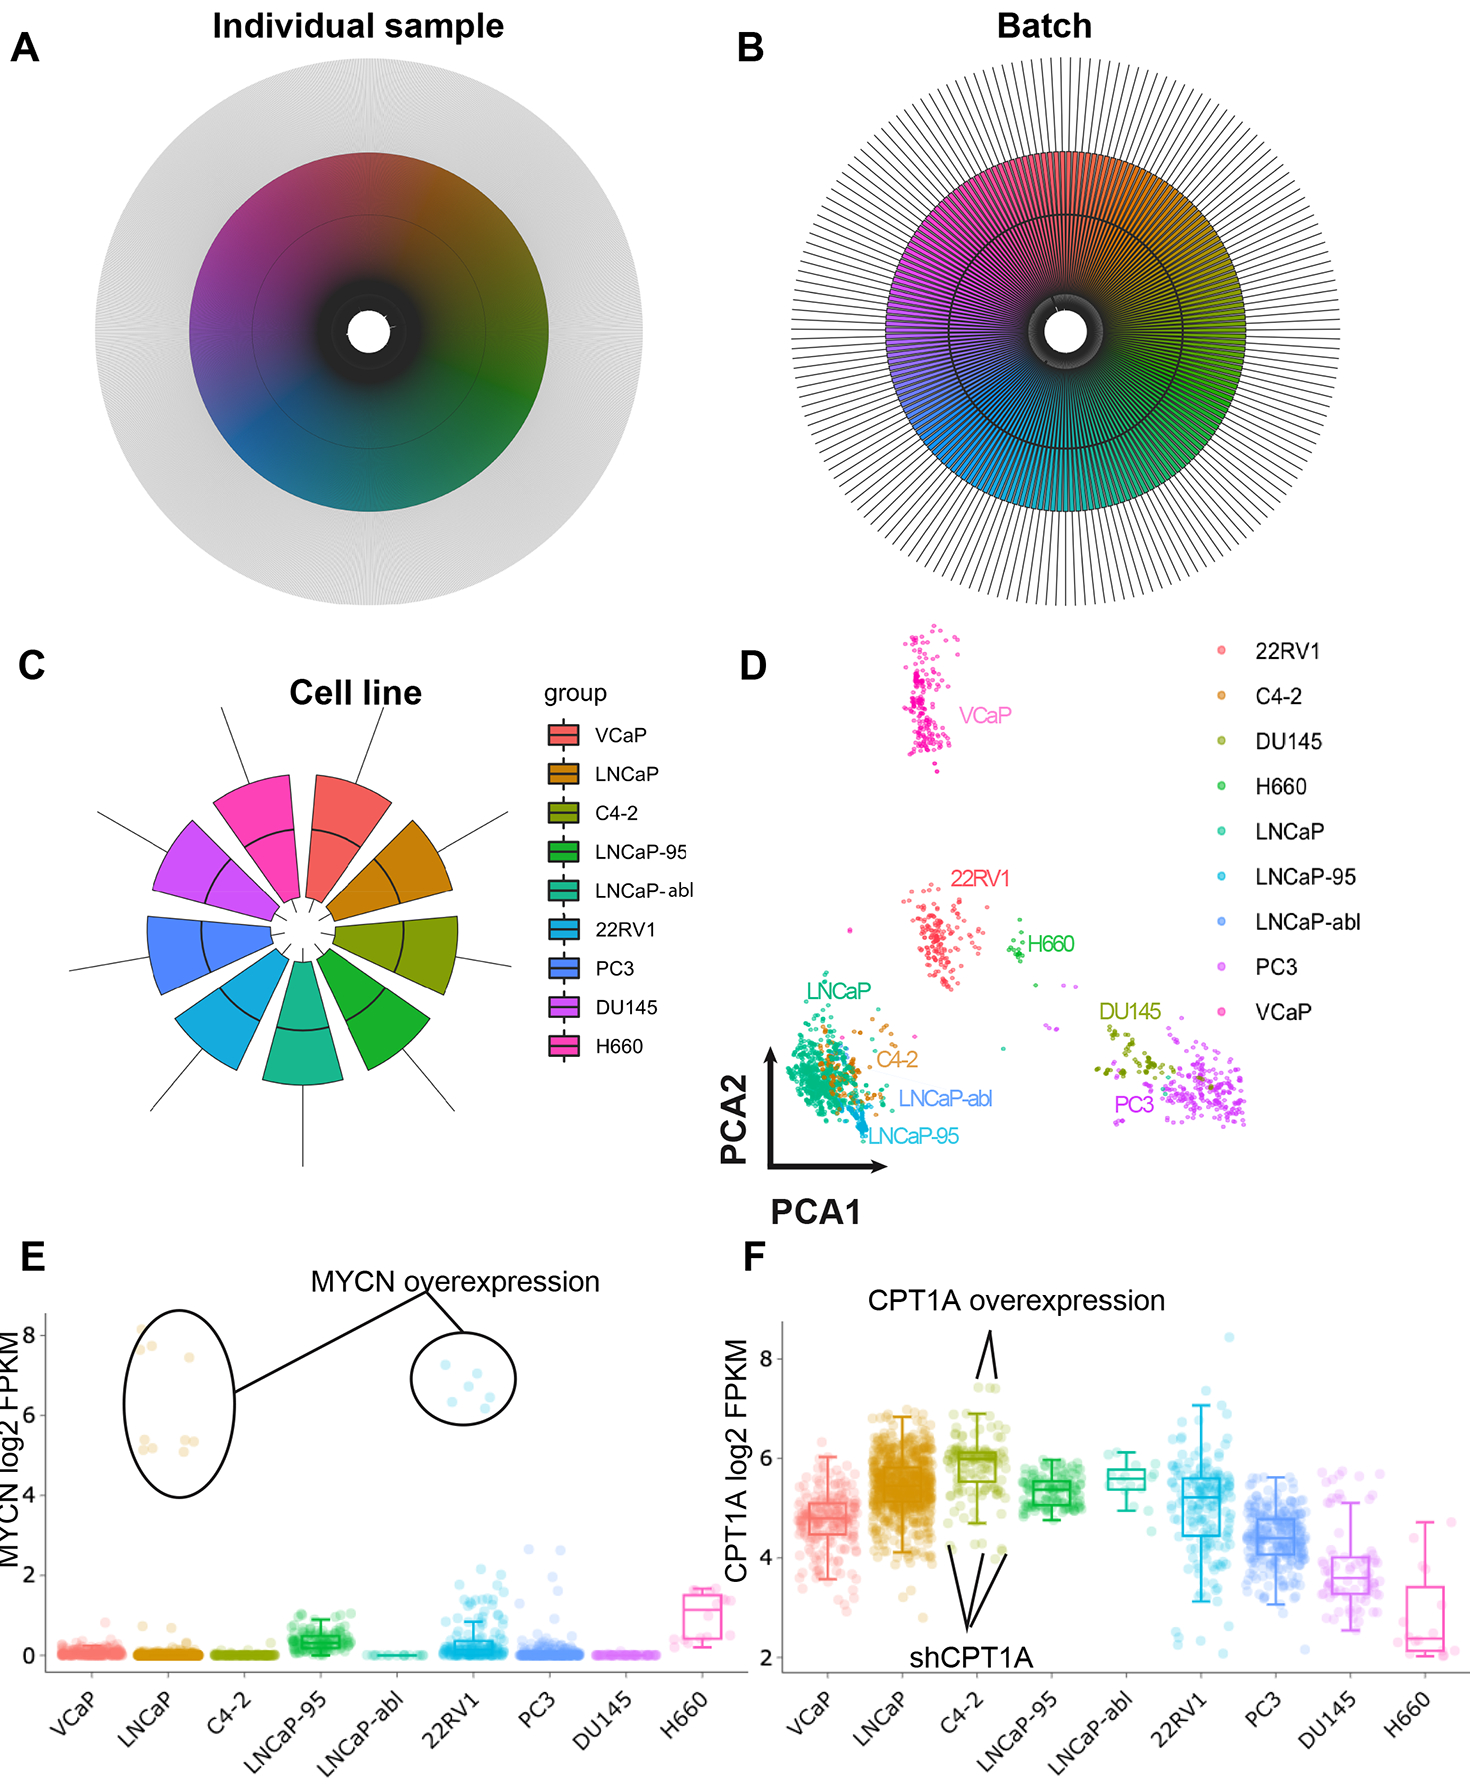
quality validations of the CTPC dataset. (A) Circular boxplot of mRNA FPKM value of individual samples in the CTPC dataset. The X axis (circumference) represents the 1840 samples (in different colors) and Y axis (radius) is the log2 FPKM value. (B) Circular boxplot of the 1840 CTPC samples grouped by batches. (C) Circular boxplot of the samples grouped by cell lines. (D) PCA visulization of the CTPC dataset. The 9 PCa cell lines were labelled with different colors. The samples from the same cell line tend to co-locate. (E and F) Boxplots generated using the interactive online platform. The samples that ectopically express MYCN, CPT1A or- shCPT1A were highlighted. The mRNA expression of these genes matches the genetic manipulation of the cells.
Discussion
The CTPC dataset is a compiled RNASeq dataset that focuses on PCa cell lines. It provides access to gene expression data across PCa cell lines with sufficient sample numbers. Additionally, the online platform enables researchers to conduct integrative analyses of gene expression in each PCa cell line, compare gene expression levels across different cell lines, and correlate the altered gene expression data with treatment conditions. The GEO accession number is also readily available for each sample. The gene expression data can be downloaded from the CTPC website and researchers can conduct statistical analyses on their genes of interest.
The gene expression levels are reflected by the median values in each PCa cell line. This information is useful for researchers to select cell lines for their research. Another important feature of the CTPC dataset is the broad range of gene expression levels within each individual cell line. The wide variations in the gene expression levels are associated with the various experimental conditions and the dots with high deviations provide even more information about the genes of interest because users can easily retrieve the experimental conditions and associate the meta information of these outlier samples with the atypical gene expression. The CTPC dataset and associated platform not only provide invaluable information about gene expression across various PCa cell lines but also break a technical barrier so that researchers can retrieve and analyze the gene expression data online without coding or any bioinformatics skills. The CTPC dataset contains the transcription profiles of nine PCa cell lines and excludes some other PCa cell lines because these other cell lines have limited number of RNAseq datasets. We will keep tracking the public databases and add these excluded cell lines to the CTPC database if and when more RNAseq data become available for them. We believe the CTPC dataset and associated platform provide a great service to the PCa research community and will enable the development of many exciting and impactful research projects.
Footnotes
Competing interests
The authors have no competing interest
Code Availability
All custom R codes are available at: https://github.com/schoo7/CTPC.
References
- 1.Cheng S & Yu X The spectrum of neuroendocrine differentiation in prostate cancer. Prostate Cancer and Prostatic Diseases 24, 1214–1215 (2021). [DOI] [PubMed] [Google Scholar]
- 2.Ghandi M et al. Next-generation characterization of the Cancer Cell Line Encyclopedia. Nature 569, 503 (2019). [DOI] [PMC free article] [PubMed] [Google Scholar]
- 3.Reinhold WC et al. CellMiner: a web-based suite of genomic and pharmacologic tools to explore transcript and drug patterns in the NCI-60 cell line set. Cancer research 72, 3499–3511 (2012). [DOI] [PMC free article] [PubMed] [Google Scholar]
- 4.Team, R. C (2018).
- 5.Team, R (2019).
- 6.Lachmann A et al. Massive mining of publicly available RNA-seq data from human and mouse. Nature communications 9, 1–10 (2018). [DOI] [PMC free article] [PubMed] [Google Scholar]
- 7.Smith R et al. Enzalutamide response in a panel of prostate cancer cell lines reveals a role for glucocorticoid receptor in enzalutamide resistant disease. Scientific reports 10, 1–13 (2020). [DOI] [PMC free article] [PubMed] [Google Scholar]
- 8.Love MI, Huber W & Anders S Moderated estimation of fold change and dispersion for RNA-seq data with DESeq2. Genome biology 15, 1–21 (2014). [DOI] [PMC free article] [PubMed] [Google Scholar]
- 9.Chang W, Cheng J, Allaire J, Xie Y & McPherson J Shiny: web application framework for R. R package version 1, 2017 (2017). [Google Scholar]
- 10.Wickham H ggplot2: elegant graphics for data analysis. (Springer, 2016). [Google Scholar]
- 11.Sievert C Interactive web-based data visualization with R, plotly, and shiny. (CRC Press, 2020). [Google Scholar]
- 12.Liu AY et al. Lineage relationship between LNCaP and LNCaP‐derived prostate cancer cell lines. The Prostate 60, 98–108 (2004). [DOI] [PubMed] [Google Scholar]
Associated Data
This section collects any data citations, data availability statements, or supplementary materials included in this article.
Data Availability Statement
All custom R codes are available at: https://github.com/schoo7/CTPC.