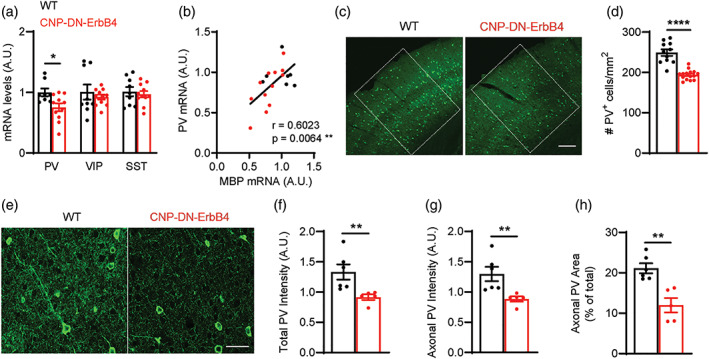
FIGURE 7.

Loss of oligodendrocyte ErbB signaling leads to reduced A1 PV+ cell density and PV mRNA levels. (a) mRNA levels for parvalbumin (PV), vasoactive intestinal peptide (VIP) and somatostatin (SST) in the A1 of WT (black) and CNP‐DN‐ErbB4 (red) mice. PV mRNA levels are reduced in A1 of CNP‐DN‐ErbB4 mice (n = 8–11; p = .0290) whereas no changes are observed in VIP (p = .51) and STT (p = .6301) mRNA. (b) PV mRNA levels correlate with MBP mRNA levels in A1 (WT: black dots; CNP‐DN‐ErbB4: red dots; Pearson's correlation r = 0.6023; p = .0064). (c) Representative photomicrographs of A1 sections from WT and CNP‐DN‐ErbB4 mice showing PV+ cells (green). Scale bar: 100 μm. (d) A1 PV+ cell density is reduced in CNP‐DN‐ErbB4 mice (n = 10–14; p < .0001). (e) Representative photomicrographs of A1 sections from WT and CNP‐DN‐ErbB4 mice showing PV+ neurons and axons (green). Scale bar: 20 μm. (f) Quantification of total PV staining intensity (cell bodies + axons) in WT (black) and CNP‐DN‐ErbB4 (red) mice (n = 5–6, p = .0043). (g) Quantification of axonal PV staining intensity (total PV intensity – cell body PV intensity) in WT (black) and CNP‐DN‐ErbB4 (red) mice (n = 5–6, p = .0043). (h) Quantification of the area covered by PV+ axons in WT (black) and CNP‐DN‐ErbB4 (red) mice (n = 5–6; p = .0087) (A.U.: arbitrary units). Unpaired two‐tailed Student's t test or Mann–Whitney test were performed. Data are expressed as mean ± SEM.
