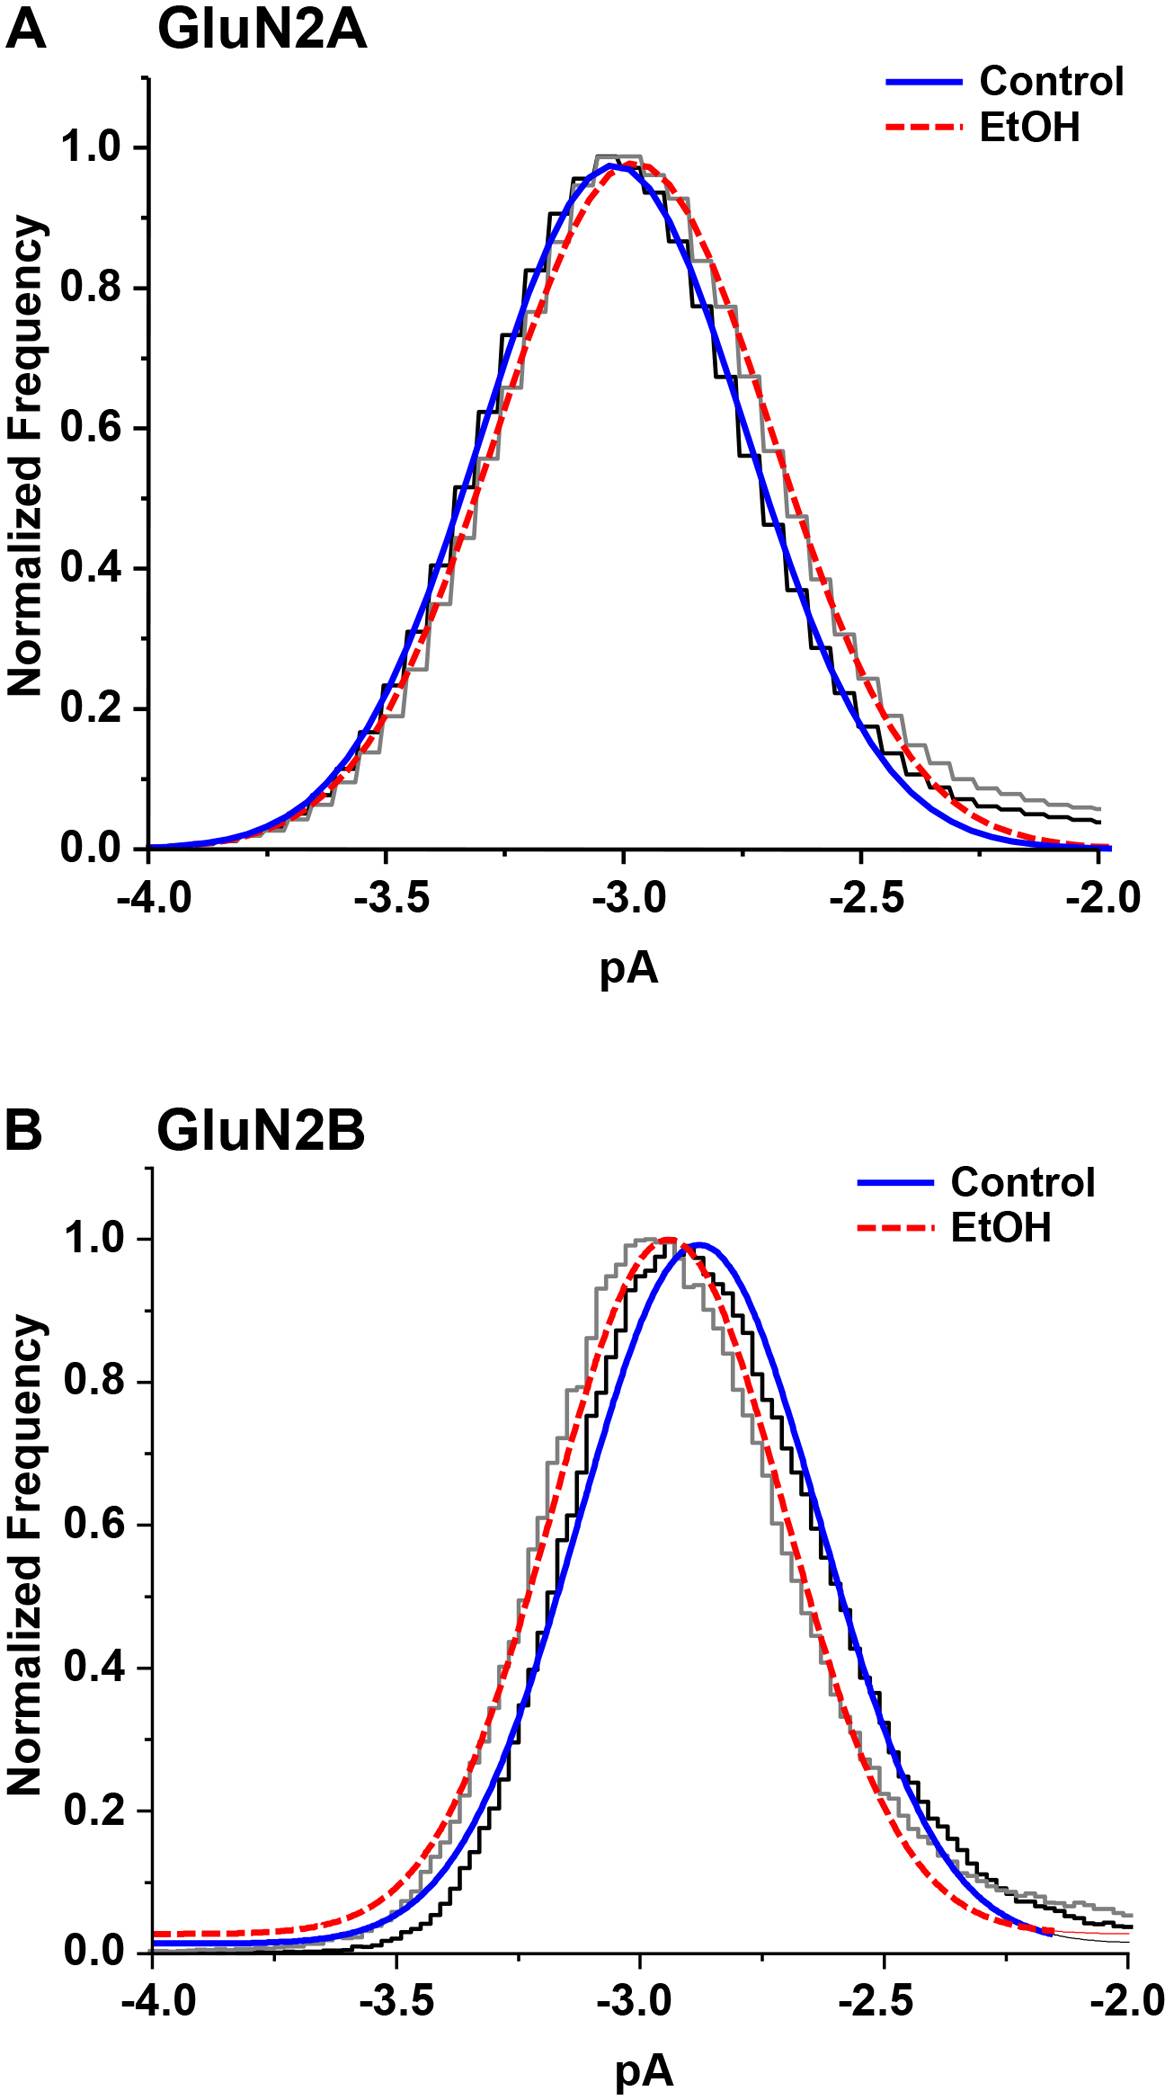
Figure 2.

Open-point histograms of glutamate-activated single-channel current amplitudes in outside-out patches from cells expressing GluN1/GluN2A (A) or GluN1/GluN2B (B) subunits in the absence (black) and the presence (gray) of ethanol (EtOH), 156 mM (A) or 150 mM (B). Curves shown are least-squares fits of a Gaussian function to the data in the absence (solid blue) and presence (dashed red) of ethanol.
