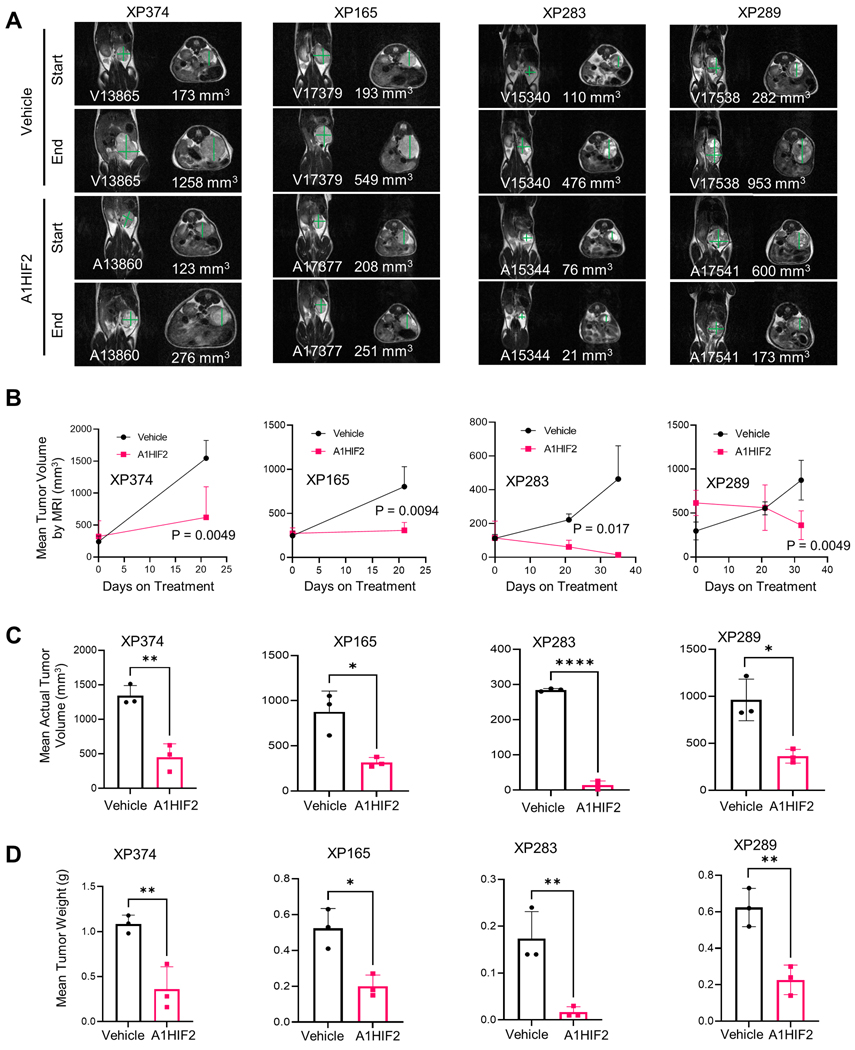
Fig. 1. Tumor growth inhibition by siHIF2 in ccRCC TGs.
A. Representative T2-weighted MRI images at baseline and after administration of A1HIF2 with corresponding tumor volume quantitation. B. Tumor volume by MRI (n=3 per arm) at baseline and at the end of treatment. C. Actual tumor volume measurements at the end of treatment. D. Tumor weight at the end of treatment. *, p < 0.05; **, p<0.01; ****, p < 0.0001. Error bars represent standard deviation.

