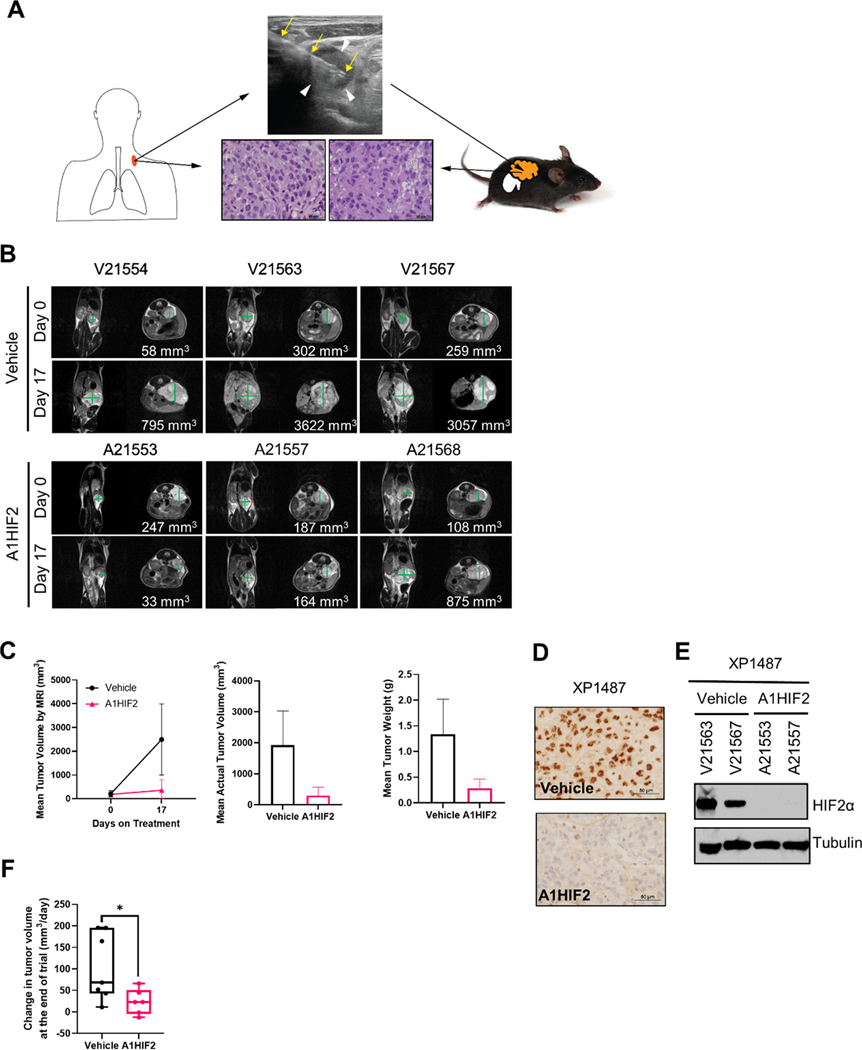
Fig. 5. HIF2α inhibition and tumor suppression by siHIF2 in TG from clinical trial participant (106–00C).
A. Schematic illustrating orthotopic TG line generation from ultrasound-guided biopsy (yellow arrows) of a supraclavicular lymph node (white arrowheads) from 106–00C (day 16) along with representative H&E images of the patient core biopsy and corresponding TG (XP1487). B. MRI images of orthotopic tumor-bearing TGs treated with A1HIF2 (or vehicle). C. Tumor volume and tumor weight analyses. D. Representative HIF2α immunohistochemistry images from A1HIF2-treated or control TGs. E. Western blot analysis of HIF2α protein in TGs treated with A1HIF2 or vehicle. F. Integrated analyses of two A1HIF2 trials in TGs from 106–00C (see also Sup Fig. 8). *, p < 0.05. Error bars represent standard deviation.

