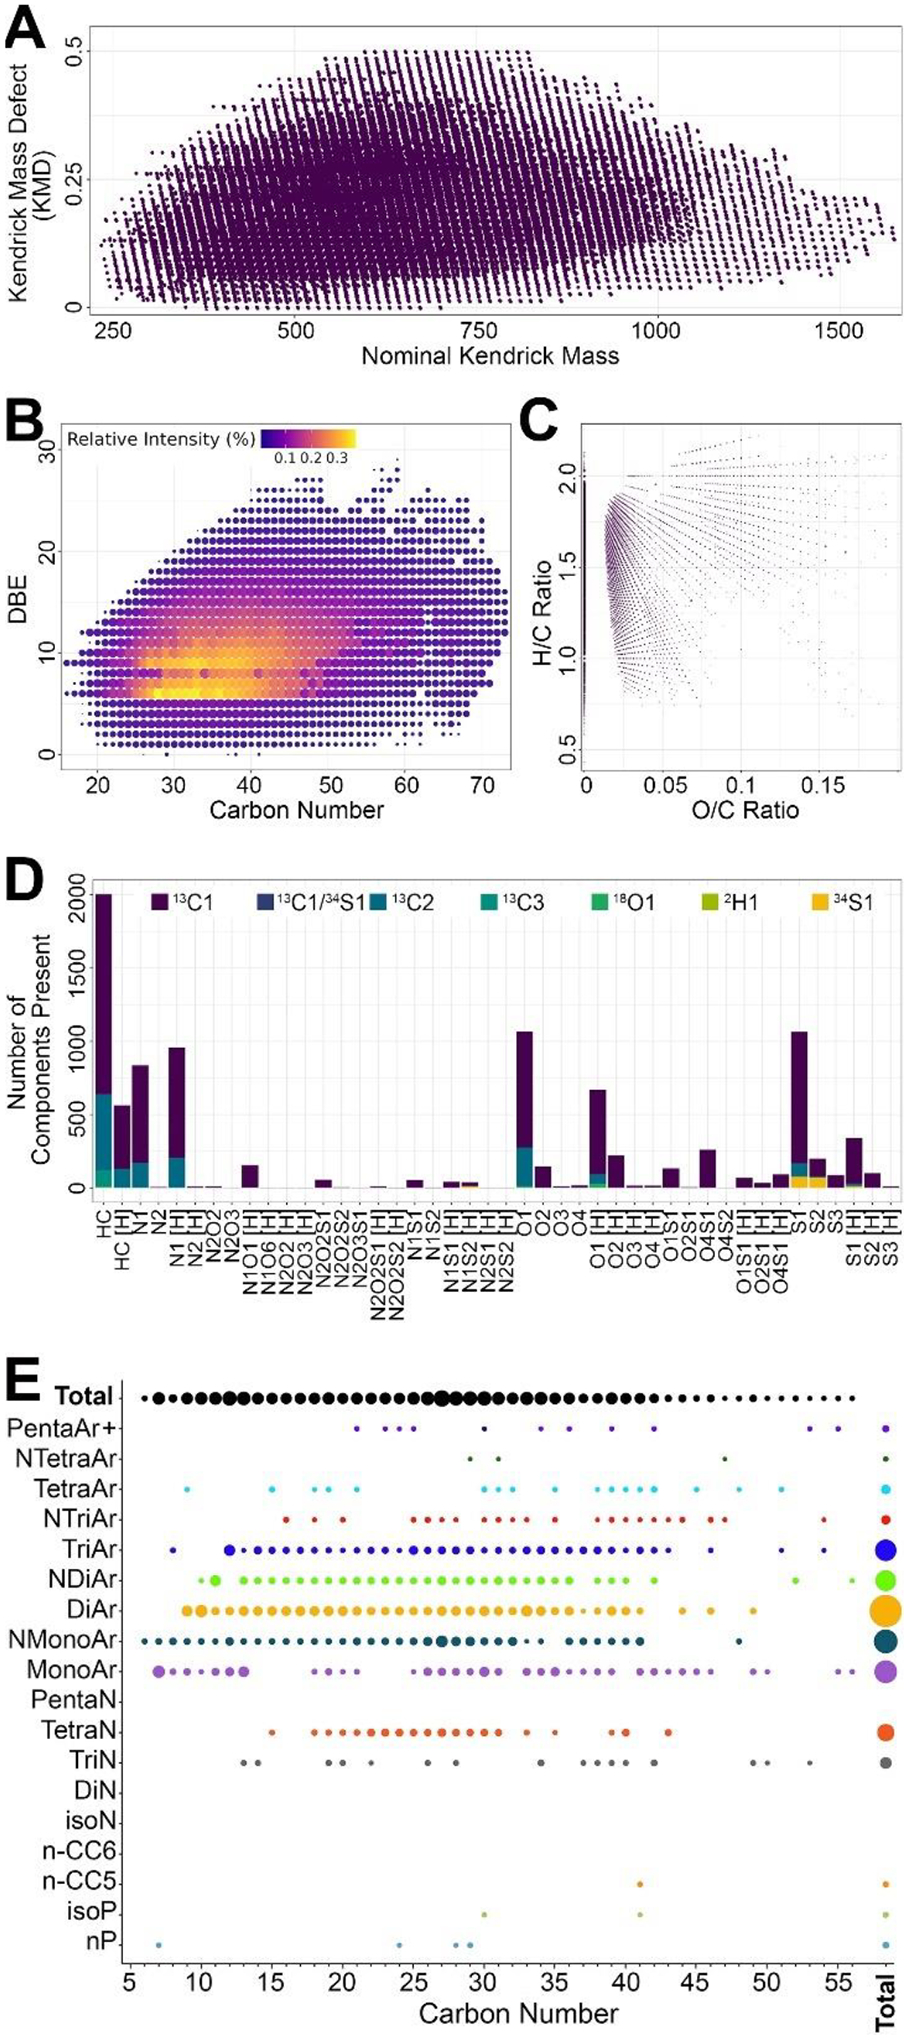
Figure 3.

Example visualizations commonly used to represent hydrocarbon composition of petroleum substances analyzed using high resolution MS techniques. (A) A Kendrick mass defect (KMD) plot demonstrating repetitive patterns of CH2-containing molecules in a petroleum sample. (B) A DBE vs carbon number plot indicating the relative proportions of molecules varying by their degree of aromaticity and carbon number in a sample. (C) van Krevelen plot display the degree of oxidation by plotting the H/C versus O/C ratio in a sample. (D) A stacked bar plot showing relative proportions of constituents from various chemical groups. (E) A plot of relative amounts of various hydrocarbon blocks in a sample.
