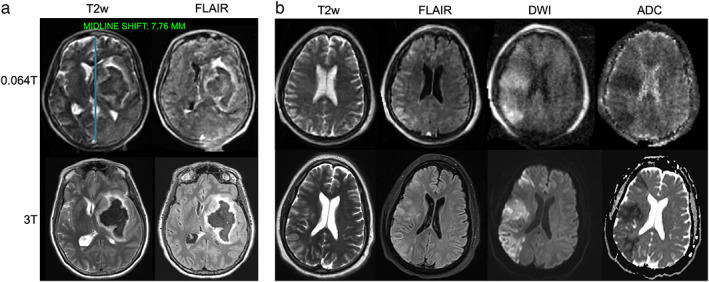
FIGURE 3.

Ischemic and hemorrhagic stroke imaging at 0.064T (top) and 3T (bottom). (a) A patient with left basal ganglia intraparenchymal hemorrhage with intravascular extension and midline shift. Midline shift was assessed using an AI‐based method embedded in the scanners picture archiving and communication system. The blue line in the top left image indicates the midline shift assessment. (b) A patient with right middle cerebral artery acute ischemic stroke image. Images provided courtesy of Dr. Kevin Sheth and Mercy Mazurek, Yale University.
